Enterprise Data
Introduction
Enterprise Data is a tool dedicated to enterprise data processing and application, aiming to assist enterprises in achieving efficient data management and intelligent application.
In terms of data management, Enterprise Data supports the creation of new enterprise data and the addition of data tables. Enterprises can customize dimensions and indicators according to their own business needs, and structure and sort out disordered data, making data management clearer and more orderly. For example, in sales data management, dimensions such as sales regions and product categories can be customized, and indicators such as sales amounts and profits can be defined to achieve precise data control. At the same time, by adding data warehouses and associating the dimensions and indicators of data tables, data integration can be further optimized, semantic models can be constructed, data islands can be broken, and the availability and correlation of data can be improved, laying the foundation for in-depth data analysis.
In AI data applications ( see: Data Appliciation), multiple data warehouses in Enterprise Data can be mounted. After the application is released, users can obtain accurate data results by simply asking questions, which will be presented in intuitive tables and graphs. Taking market analysis as an example, when users ask about the sales proportion of each product line in different quarters, the system can quickly extract information from structured data and display it clearly in the form of charts, helping enterprise managers to quickly understand market dynamics and make decisions.
Combined with functions such as chart applications, database connections, dictionary management, and terms, Enterprise Data provides comprehensive data processing support for enterprises. Whether it is personalized settings such as prompt words and instructions before a dialogue, or the configuration and display of charts such as bar charts and pie charts, it can meet the diverse data interaction and display needs of enterprises, helping enterprises fully tap the value of data.
Basic Principle
Enterprise Data is built around the core of "Semantic Data Modeling + LLM-powered Intelligent Q&A + Visual Report Generation", forming a closed-loop of data intelligence from enterprise data governance to natural language interaction. Its mechanism can be divided into the following key components:
- Headless BI
The underlying data modeling adopts the Headless BI concept, emphasizing the Model as a Service (MaaS) philosophy. The core structure includes:
Domain: Used to divide enterprise knowledge by business area; serves as the basic unit for model management and permission control.
Model: Each data model is built on a physical table or SQL logic view and supports the definition of primary keys, dimensions, measures, and time-period fields.
Dimension: Used for data slicing and aggregation analysis.
Measure: Carries business metric calculation logic (e.g., SUM, AVG, COUNT).
Metric: A secondary encapsulation of measure fields; metrics can be defined through formulas and threshold rules to form a set of business indicators.
Term: Defines the mapping between natural language vocabulary and model fields to enhance the large model’s comprehension capability.
- Natural Language Parsing and SQL Generation
The system is embedded with a Large Language Model (LLM) that dynamically parses natural language queries into SQL statements based on term mappings and semantic models. The process includes :
Intent Understanding: The LLM parses the user’s input and identifies metrics, filter conditions, grouping fields, and time ranges.
Term Mapping: Maps the “business language” used by users to specific fields and model elements.
SQL Generation: Dynamically generates standard SQL queries and adapts them to the corresponding database engine (e.g., MySQL, PostgreSQL).
Semantic Correction and Contextual Association: Supports follow-up and multi-turn questioning to continuously refine SQL generation results.
- Automated Chart Generation and Visualization
After the natural language query is executed via SQL, the system automatically recommends suitable visualization charts based on the results. The underlying mechanism includes:
Chart Recommendation Engine: Automatically recommends chart types based on field types, data characteristics (categorical/numerical/time-based), and user preferences.
Chart Rendering Engine: Uses components such as ECharts for visual rendering, supporting interactive linking, chart block reuse, and embedding/export.
Chart Semantic Retention: Each chart retains its original semantic information (SQL, dataset, user intent) for traceability and regeneration.
Operation Guide
The steps to create enterprise data are as follows:
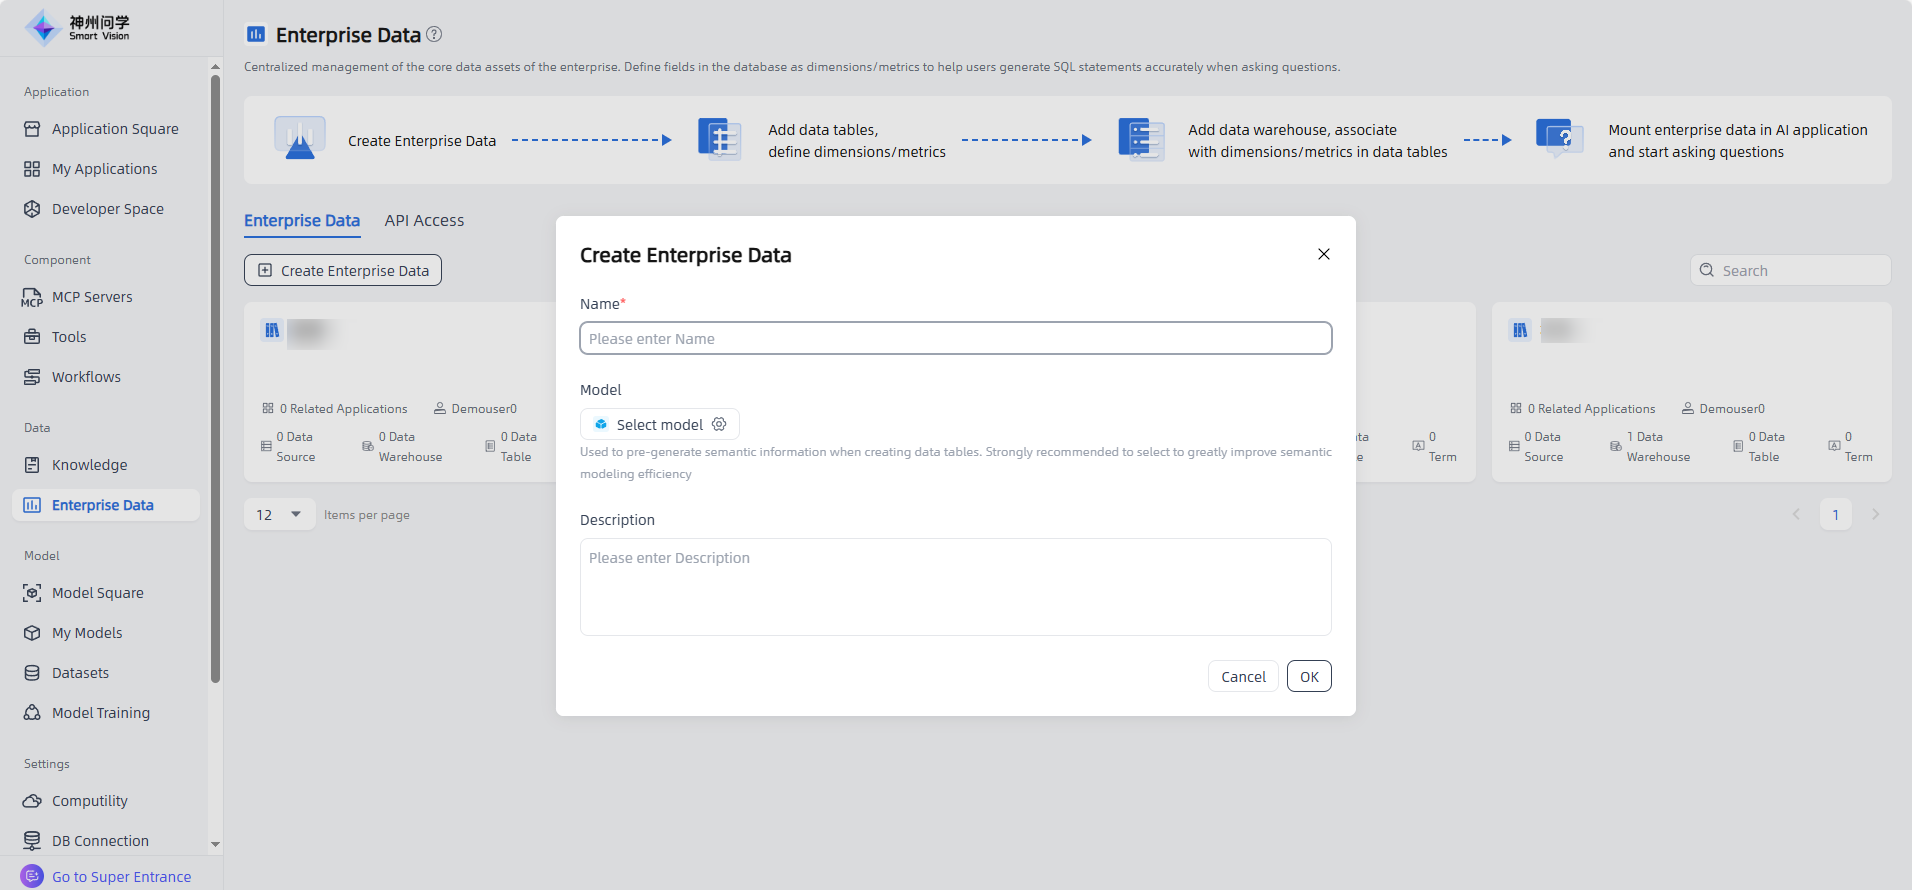
Create Enterprise Data
Start: Go to "Data-Enterprise Data", click the "Create Enterprise Data" button in the upper left corner to enter the "Create Enterprise Data" page. Fill in the enterprise data name and description, click the "OK" button to start creating the enterprise data.
Data Table Management
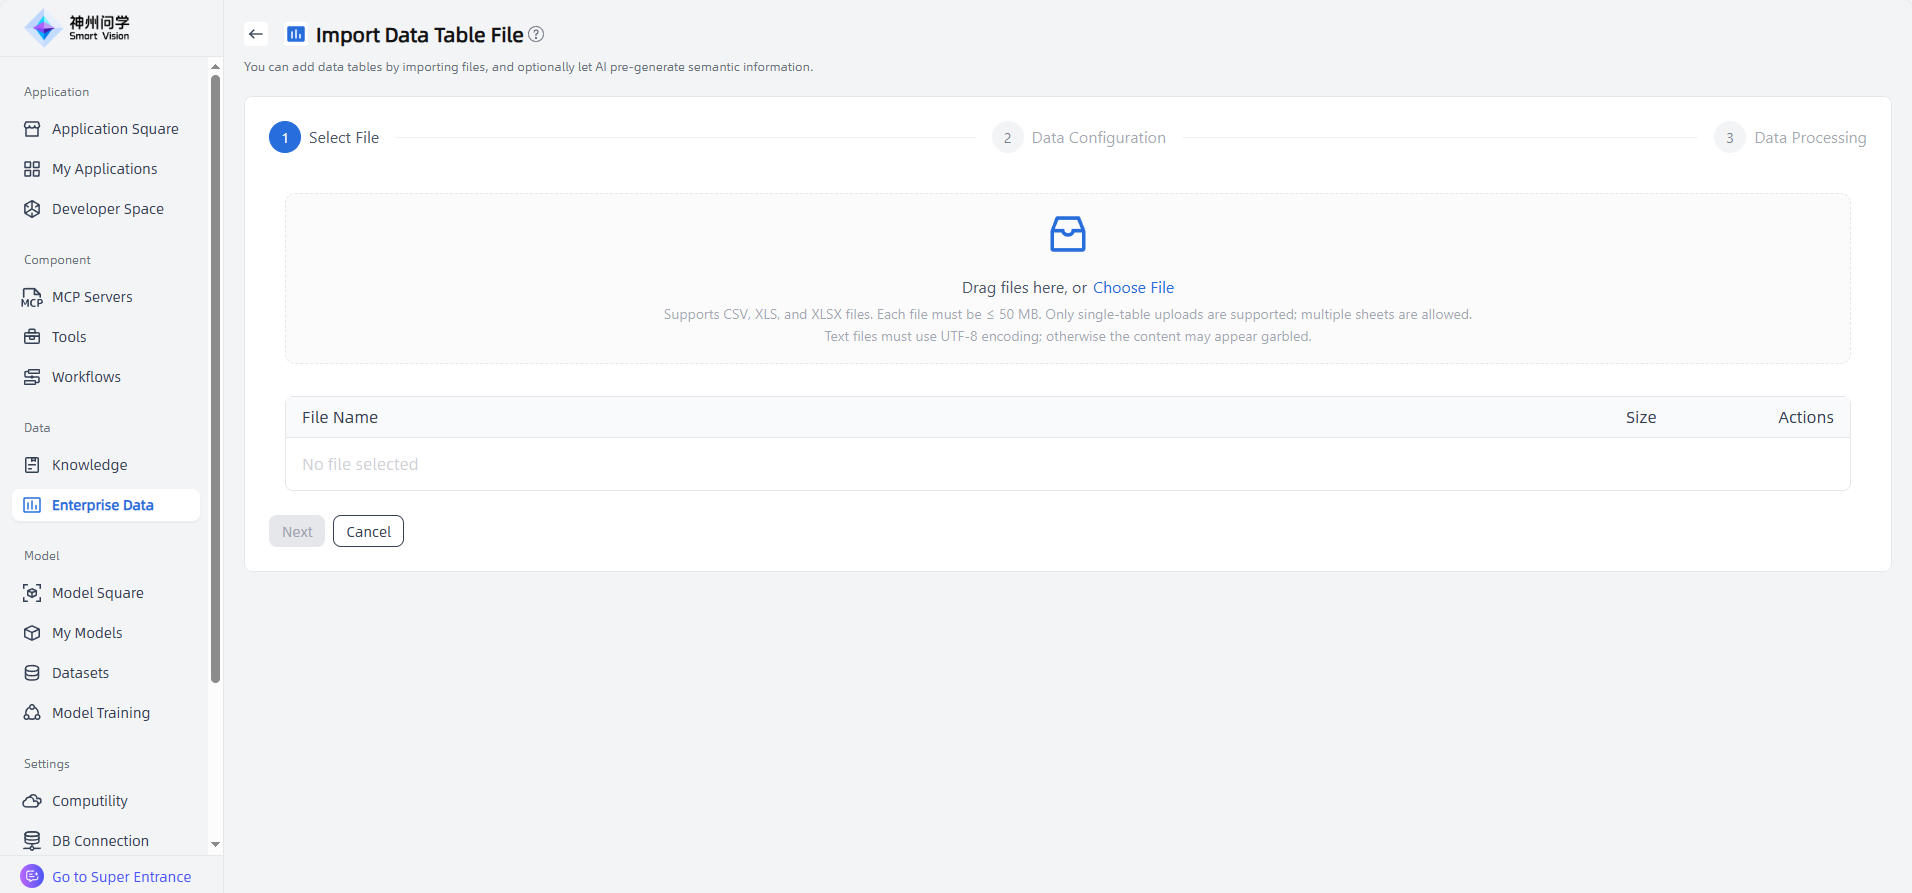
Open your created enterprise data ,click "Add Data Table" button in the upper left corner to add a new data table.There are three available methods for adding data tables, all of which support AI to auxiliary generate semantic information.
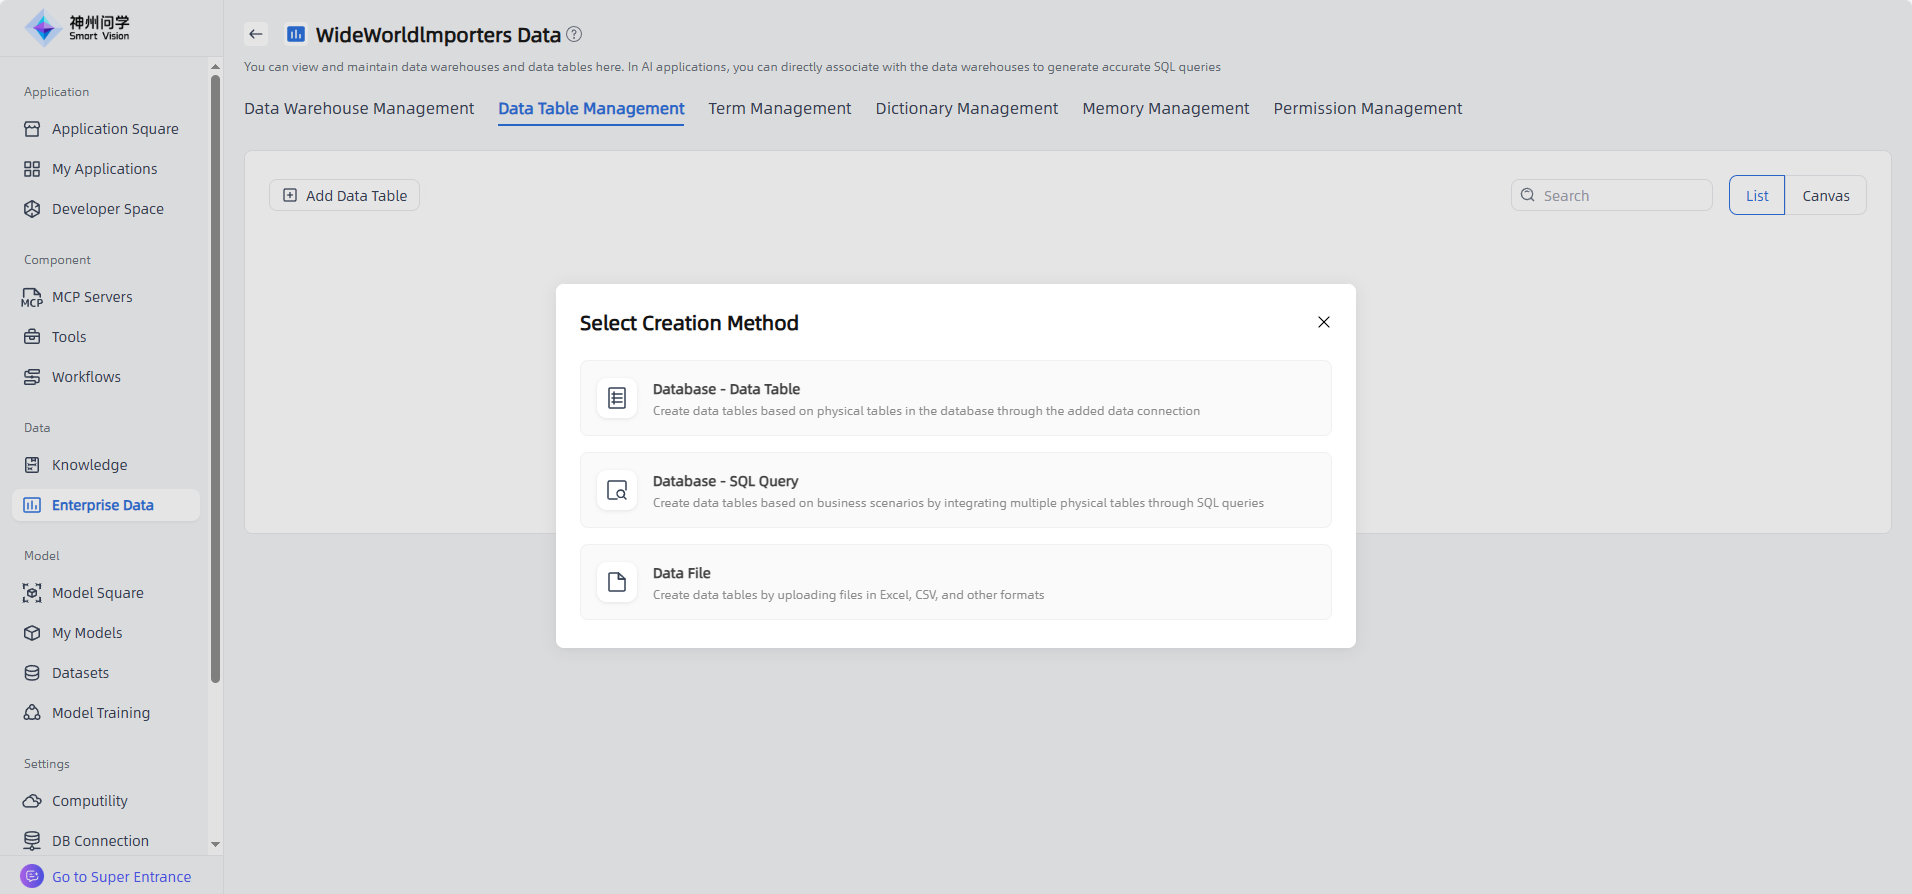
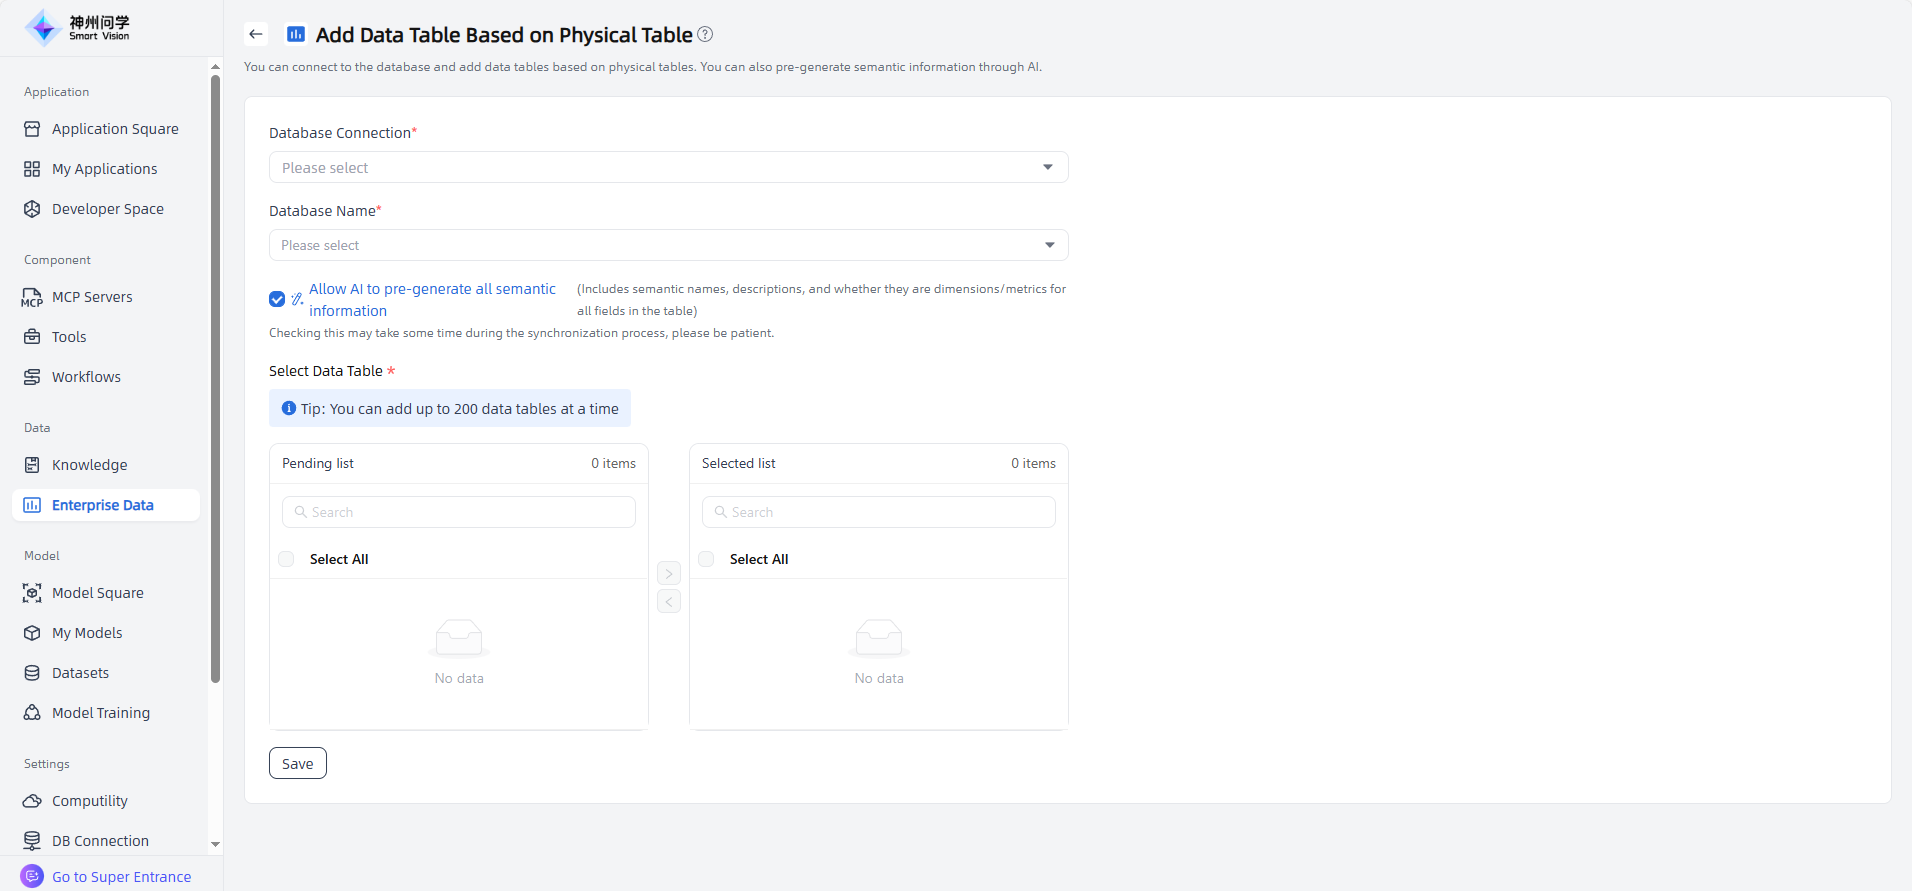
Database - Data Table : Create data tables based on physical tables in the database through the added data connection. After selecting the database connection and name,you can choose the data tables to add. Batch addition is supported, as well as selecting specific fields to include.
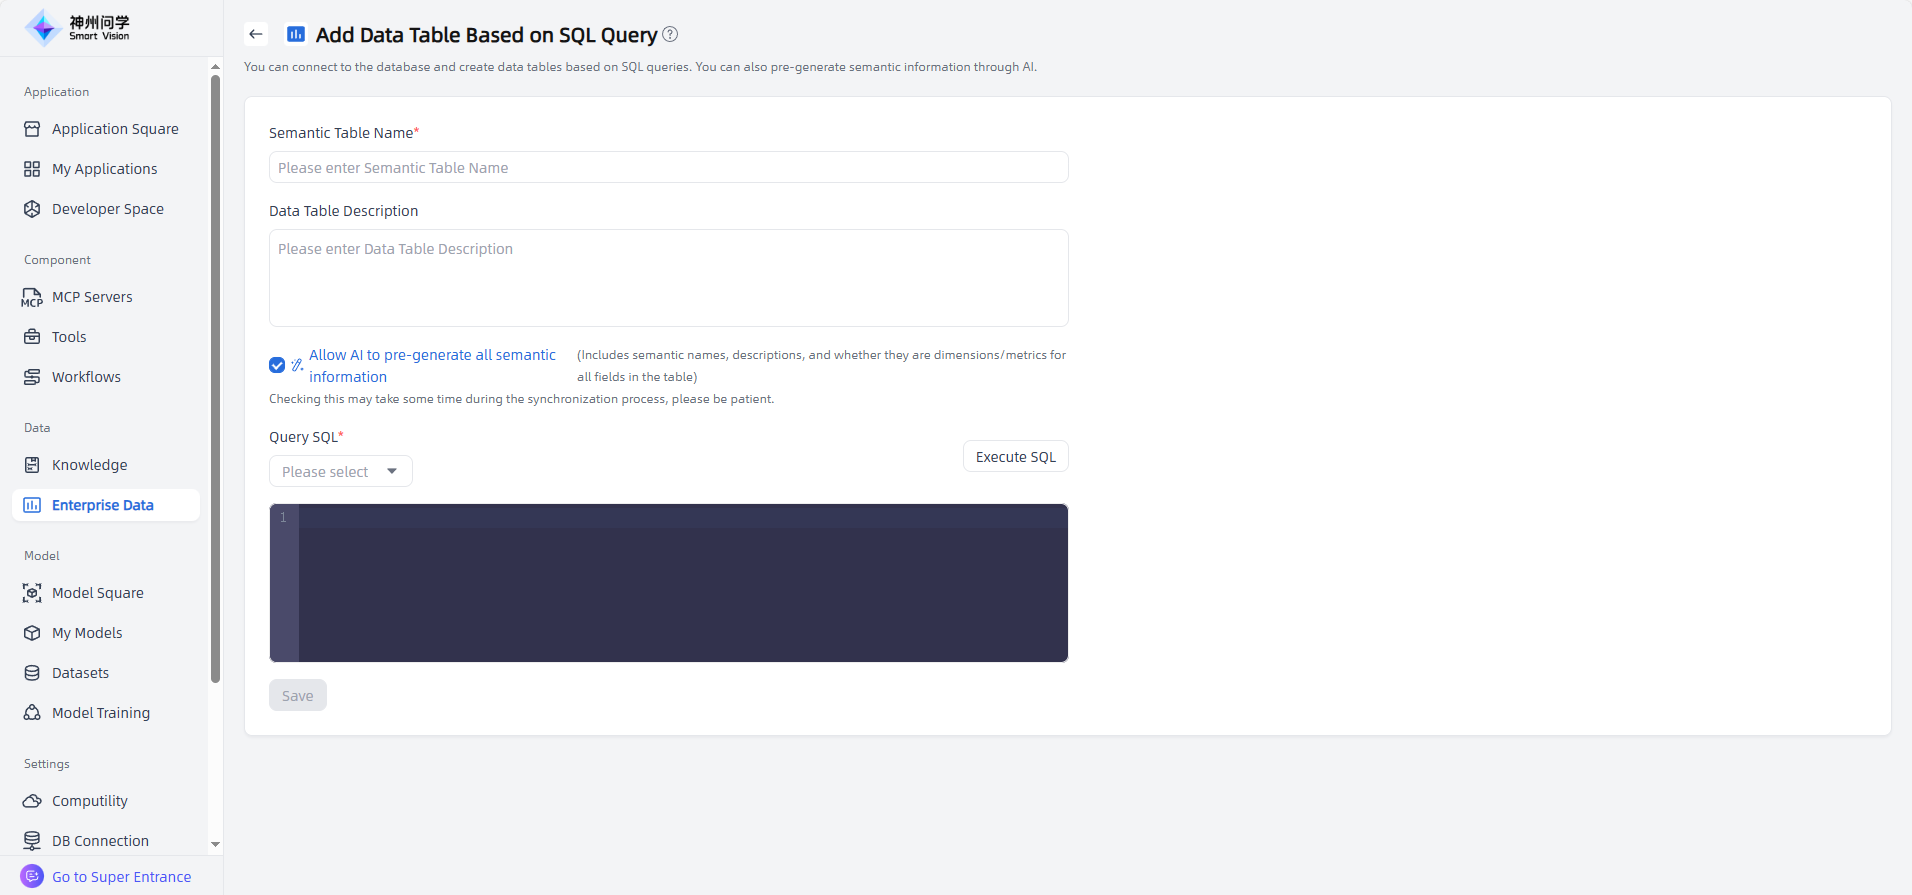
Database – SQL Query: Create data tables based on business scenarios by integrating multiple physical tables through SQL queries. After selecting the database connection and name, you can write the SQL query to build the table, and select the fields to add.
Data File: Create data tables by uploading files in Excel, CSV, or other supported formats.
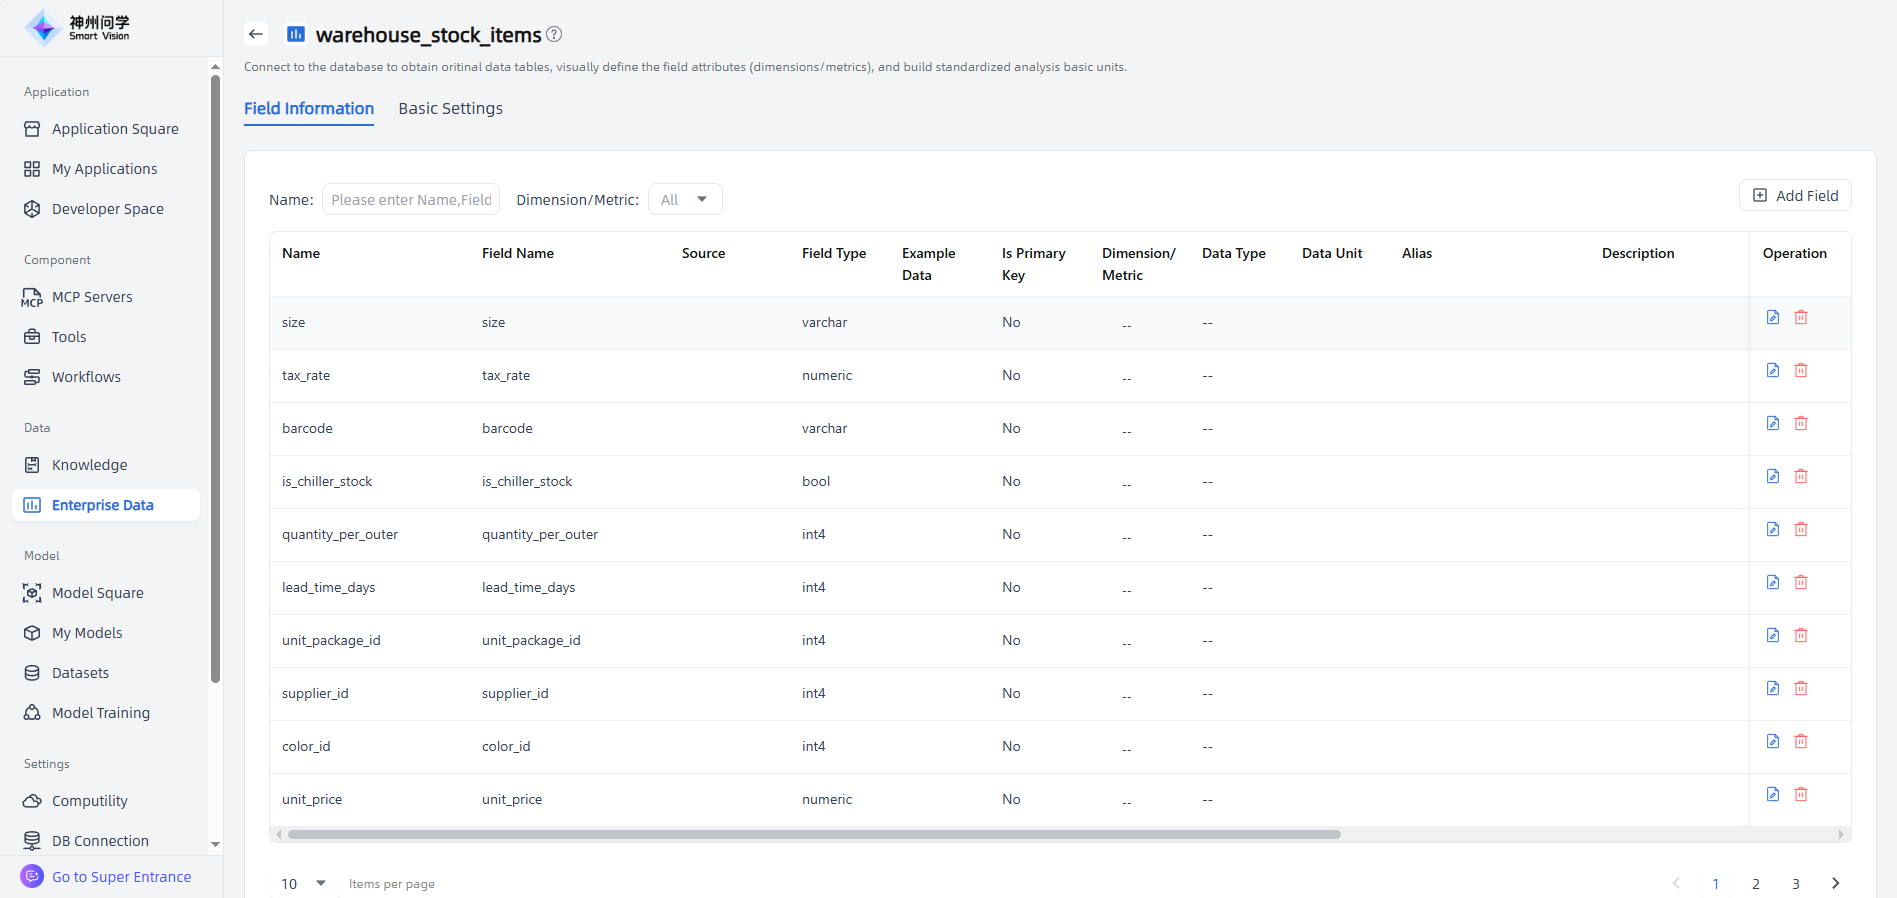
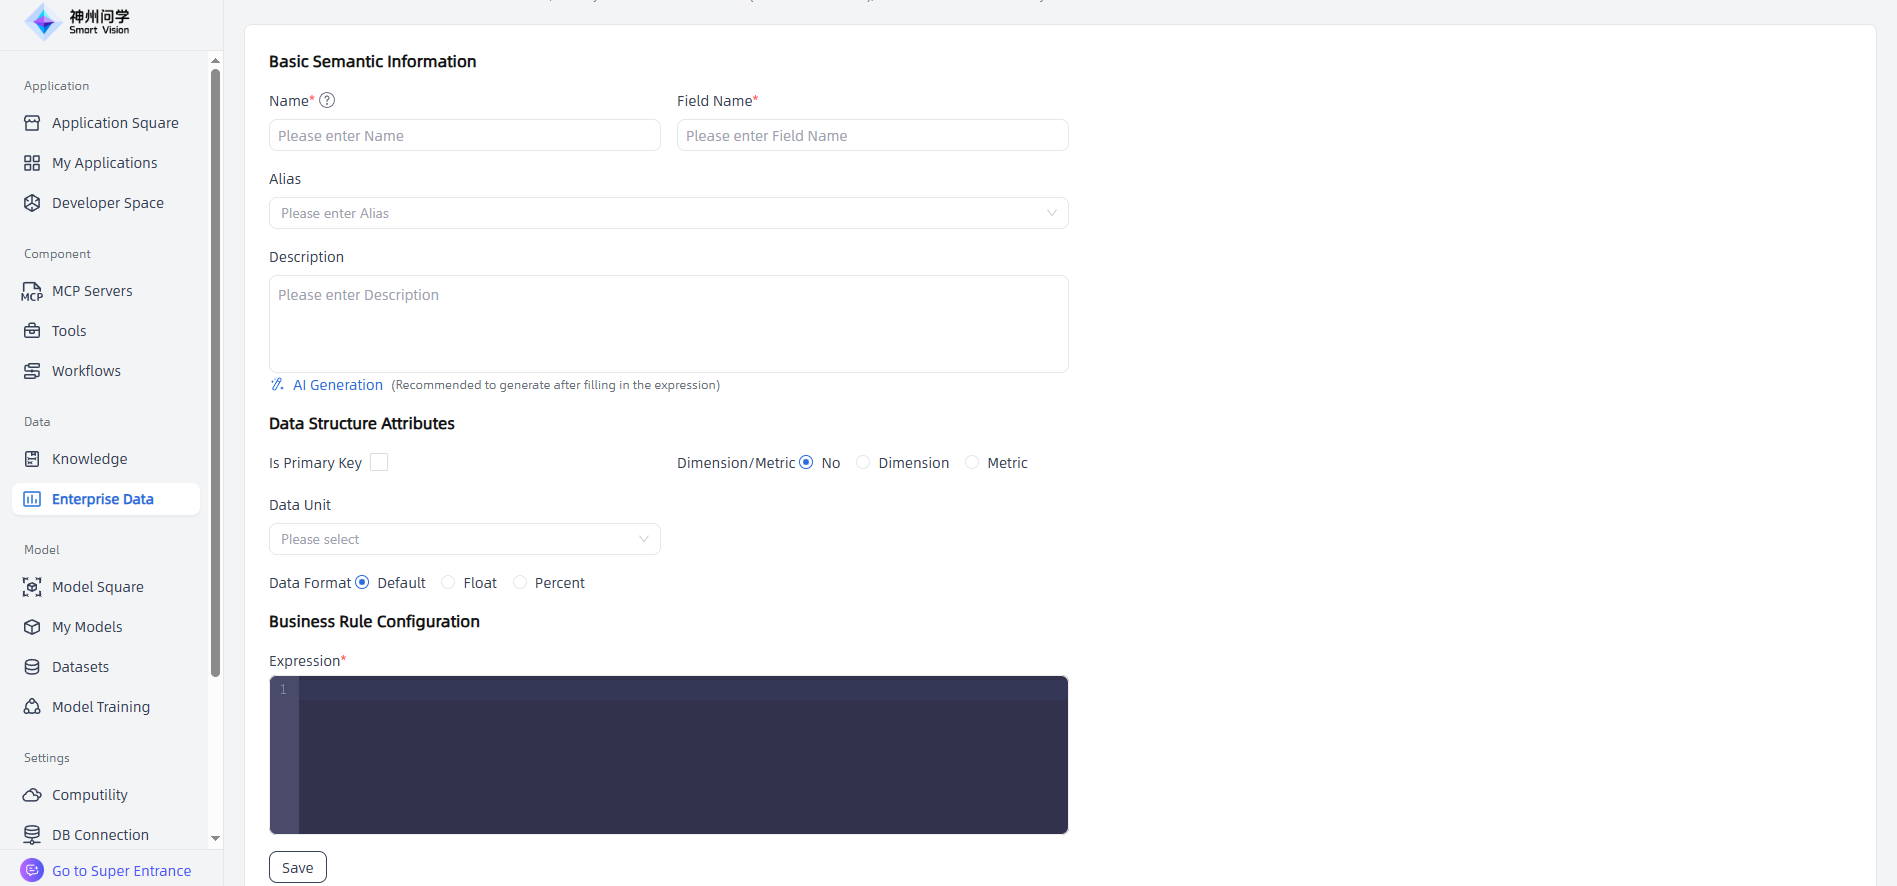
After adding the data tables, click the Edit button corresponding to a table to enter the editing page, where you can add fields and define dimensions and measures for that table.
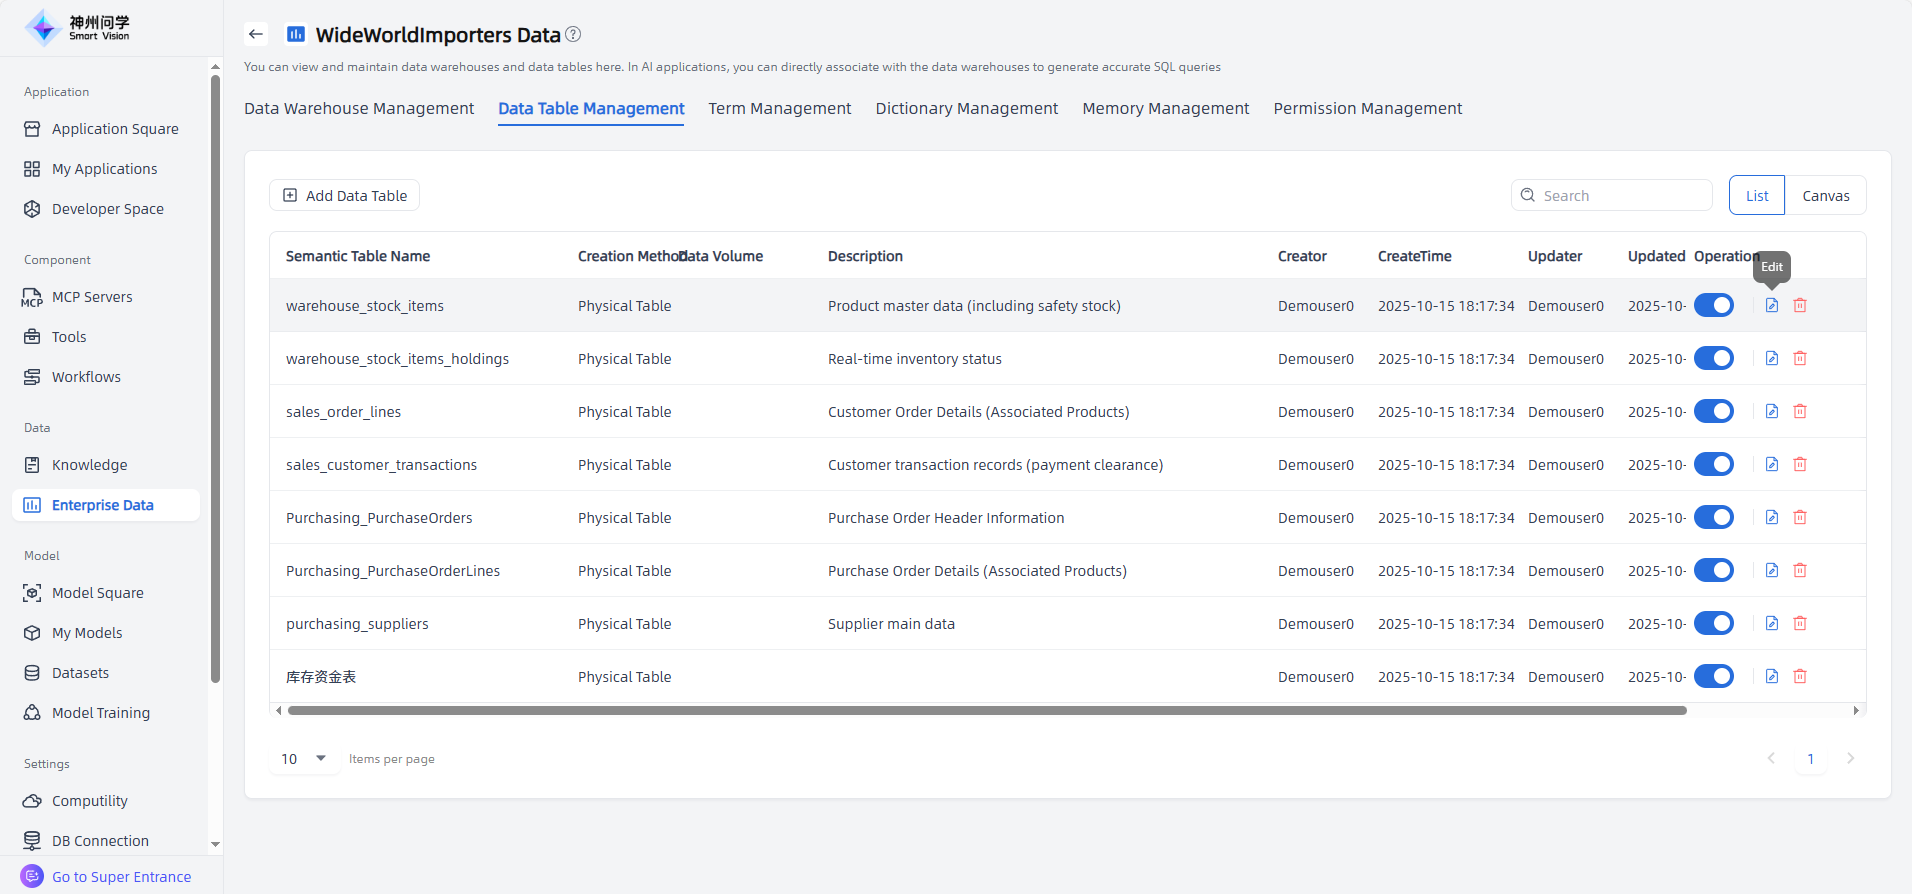
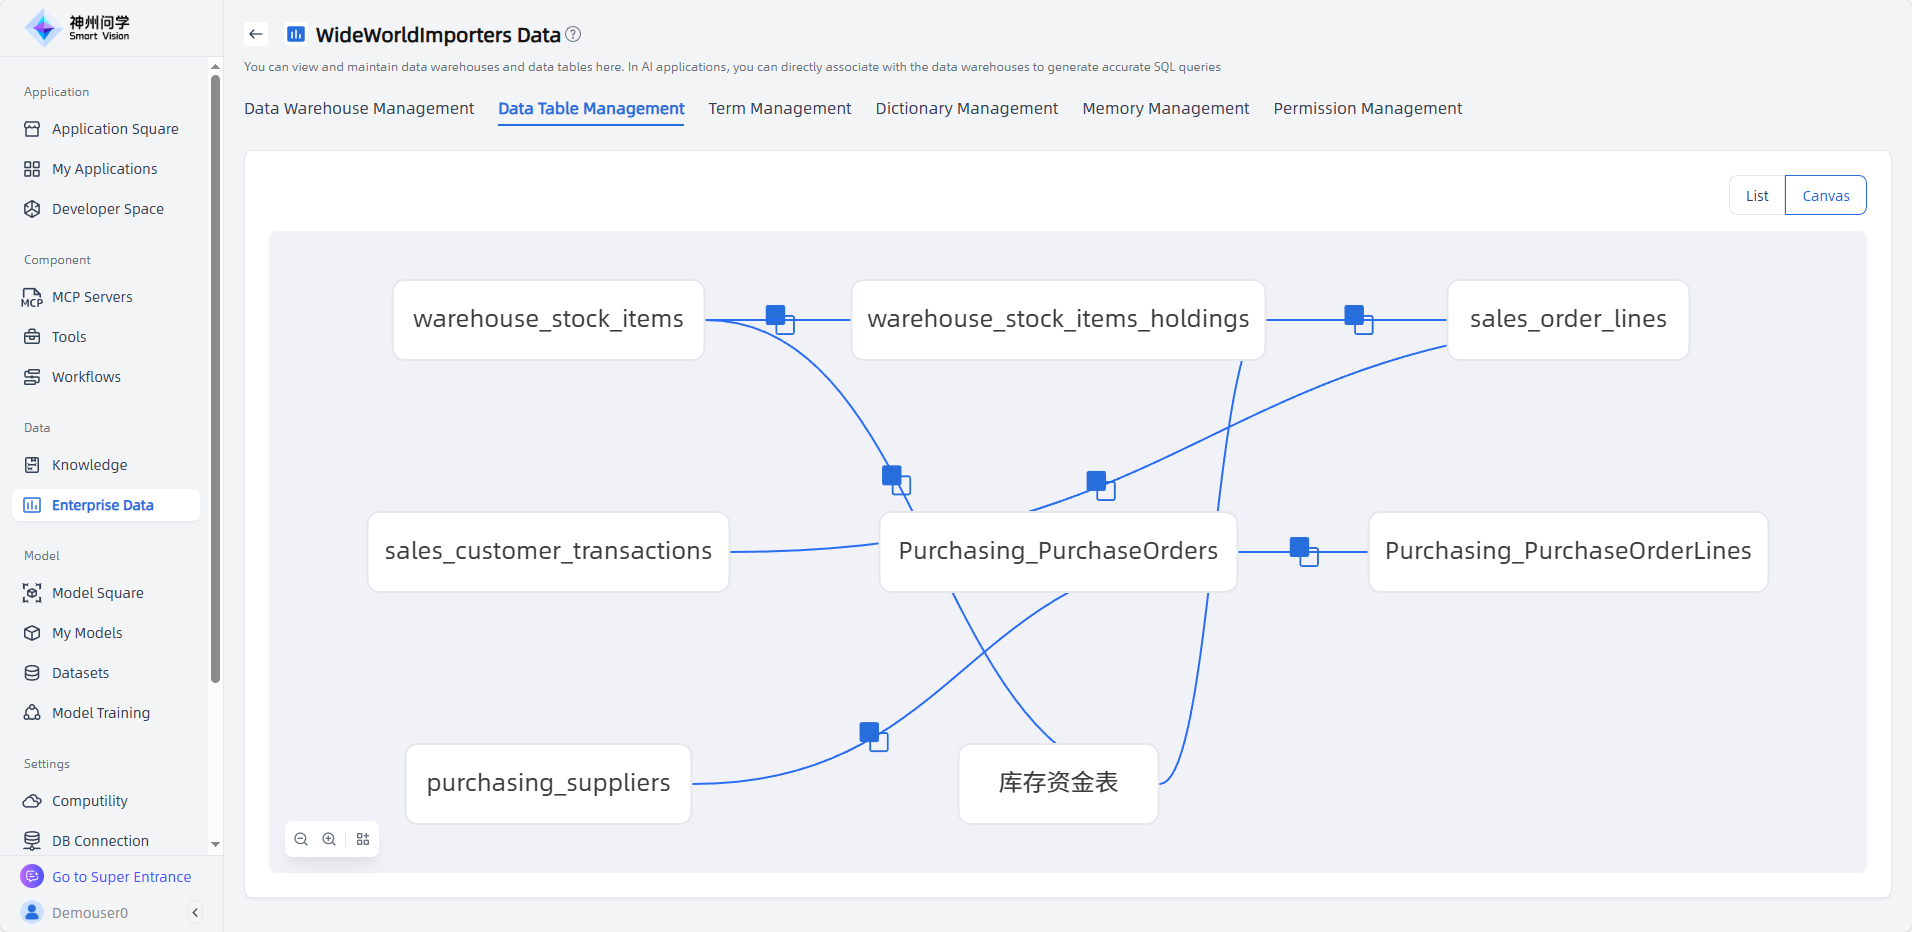
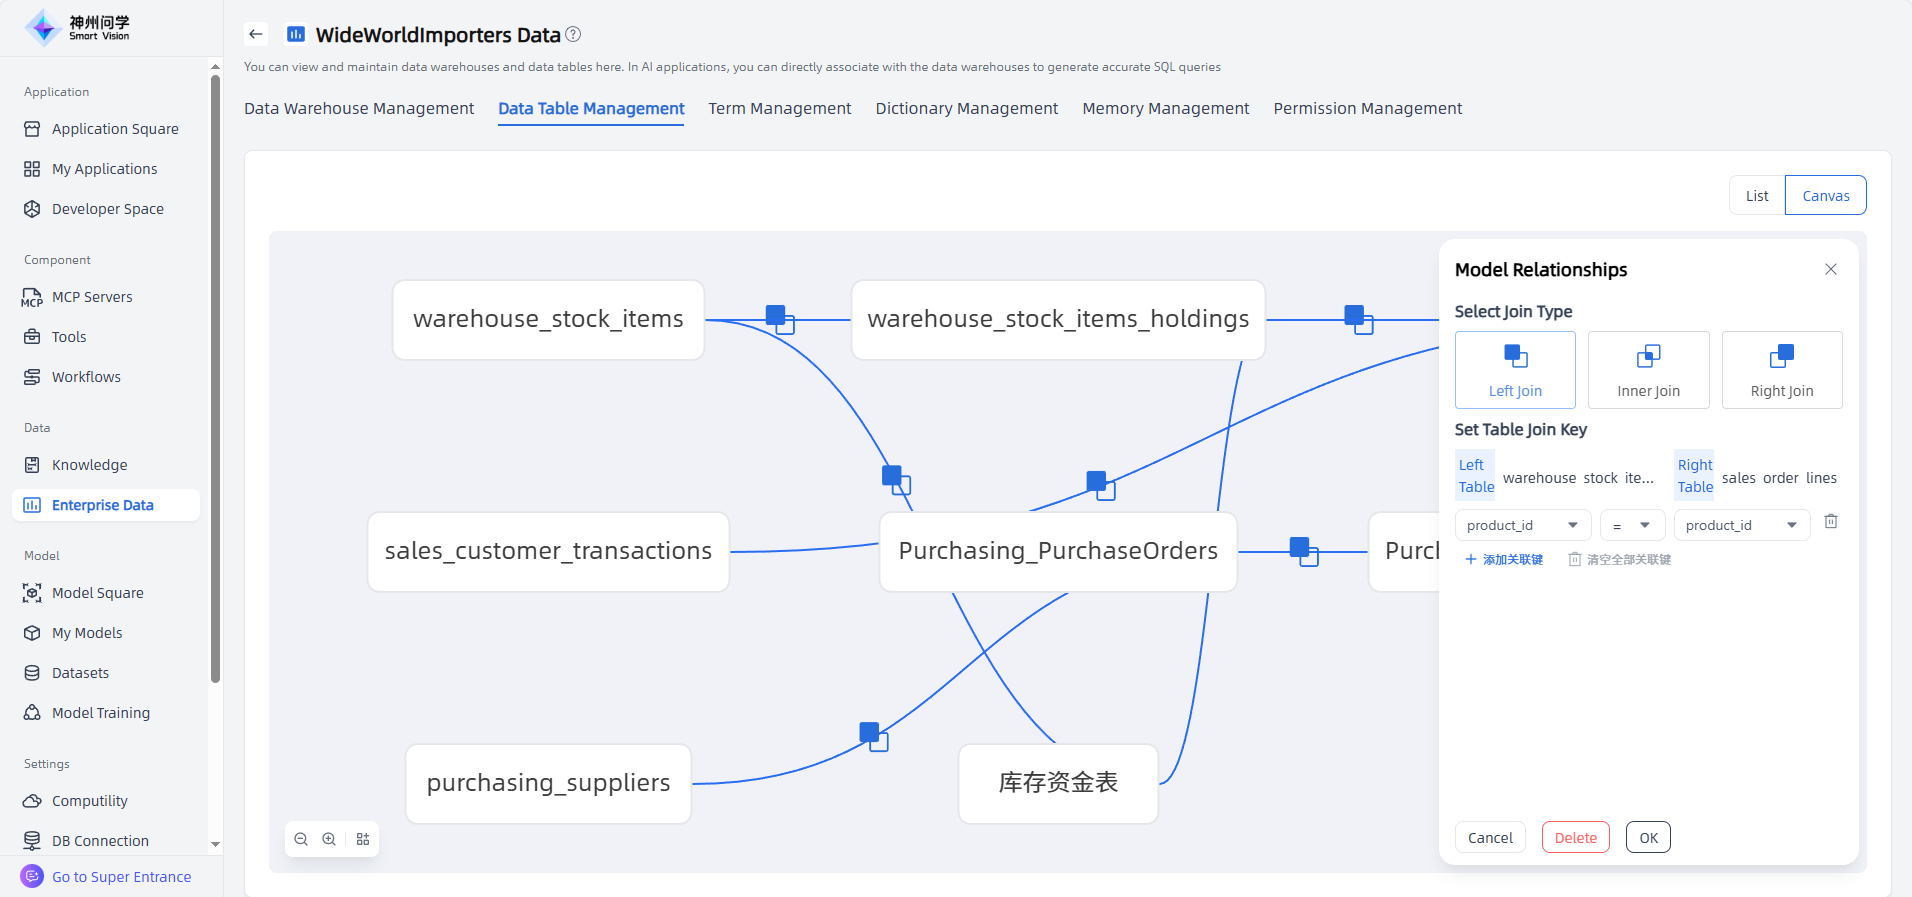
In Data Table Management, you can switch to the Canvas view from the upper-right corner to manage model relationships in canvas mode.
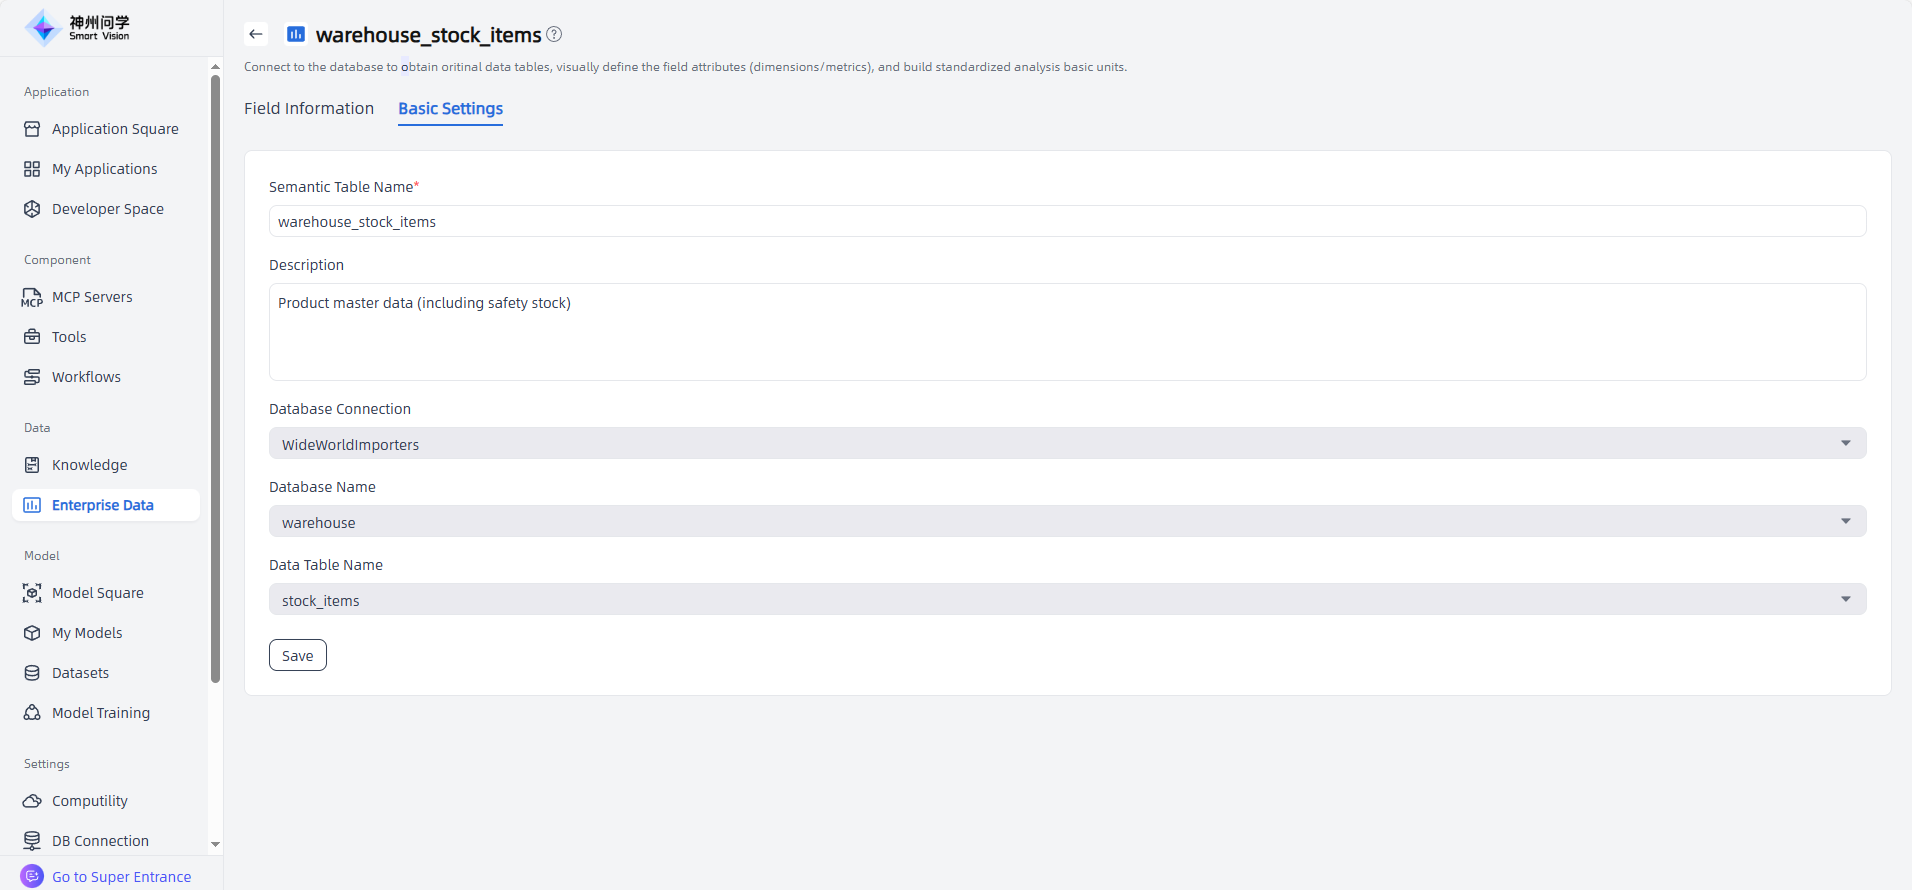
For added data tables, you can modify their name and description through Basic Settings.
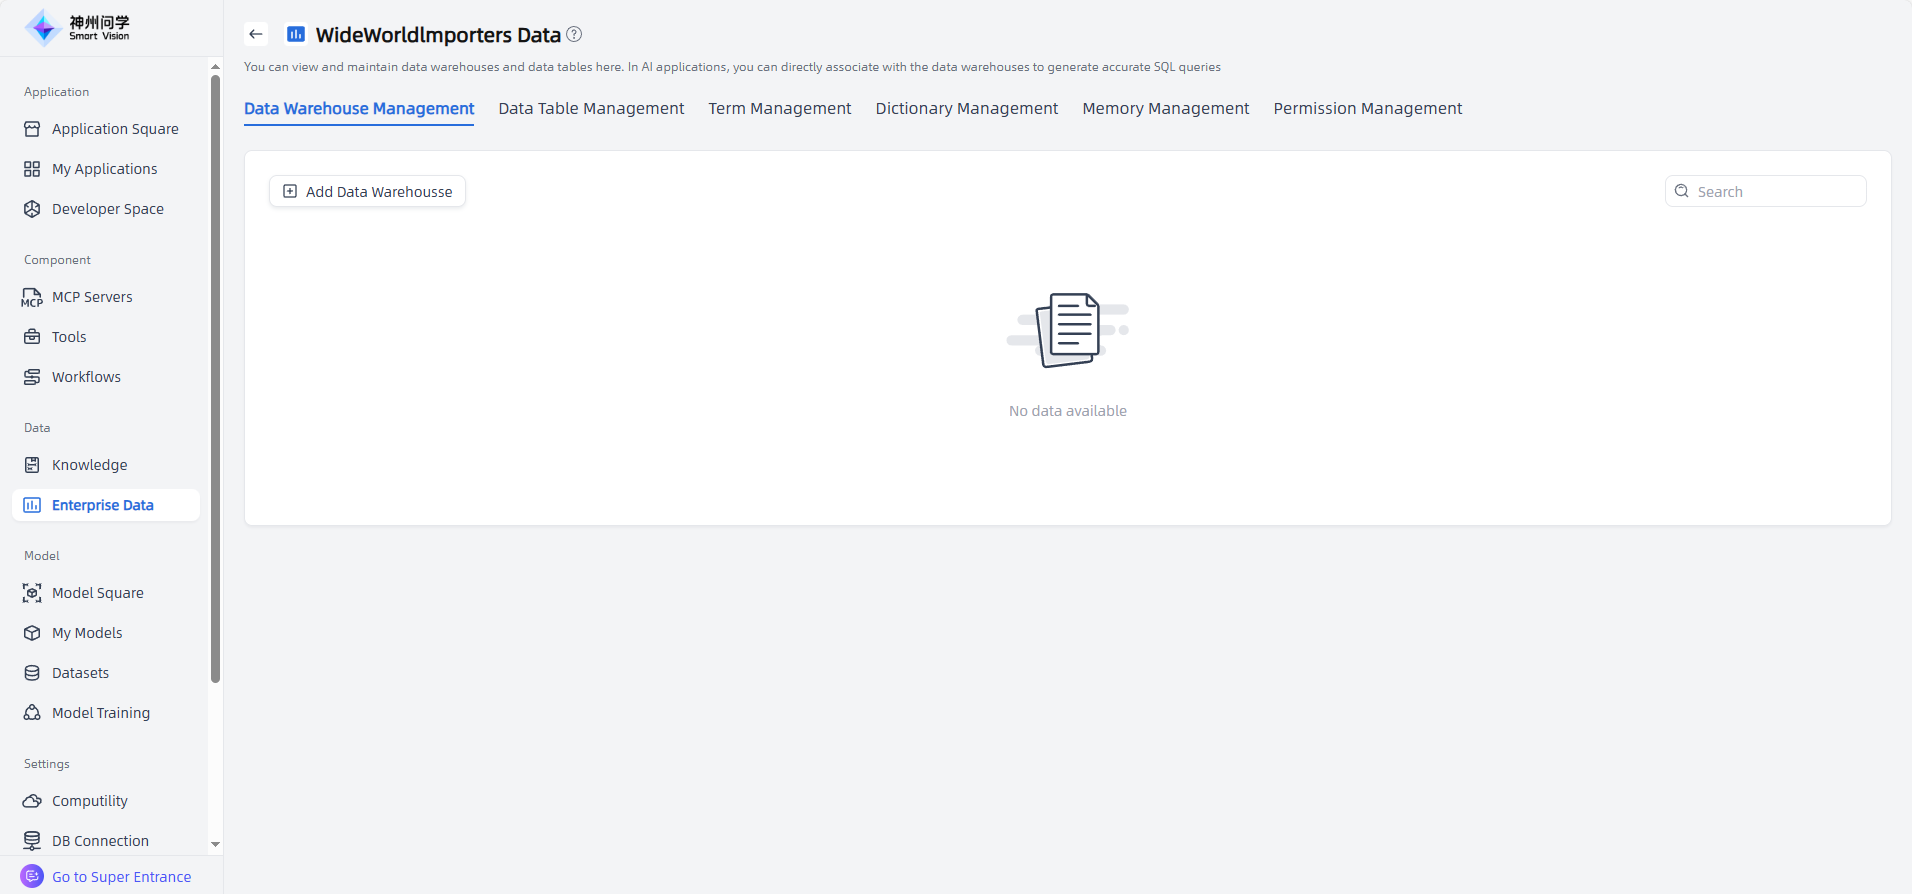
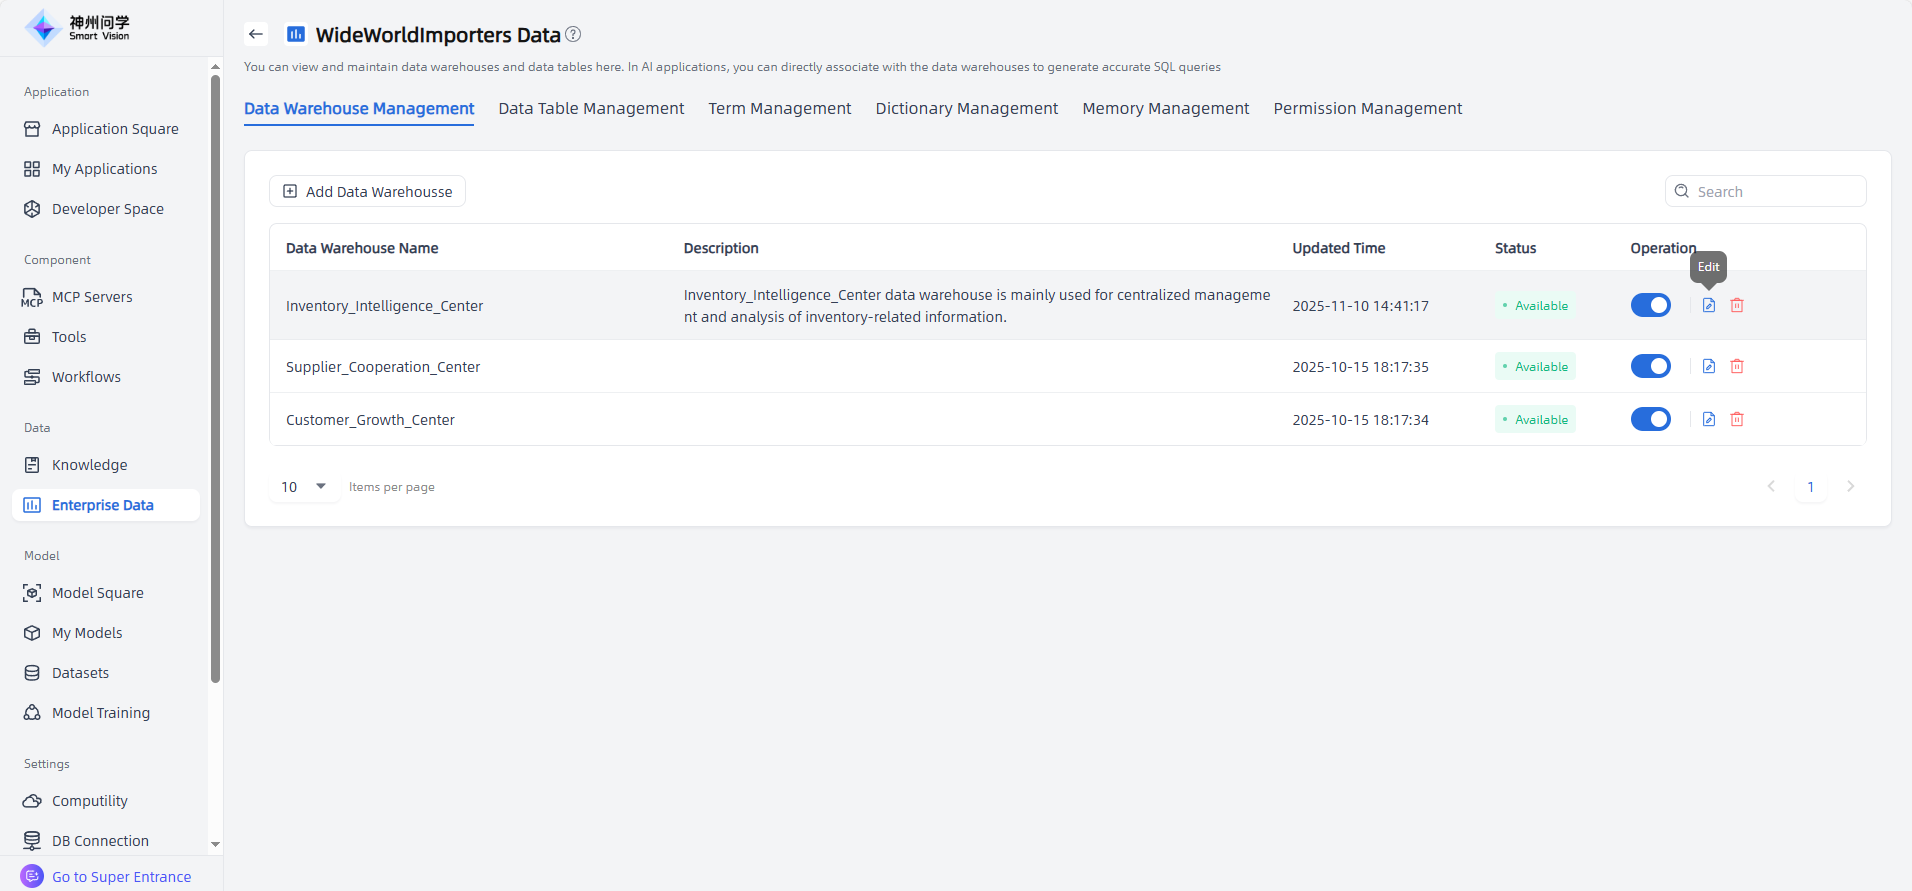
Data Warehouse Management
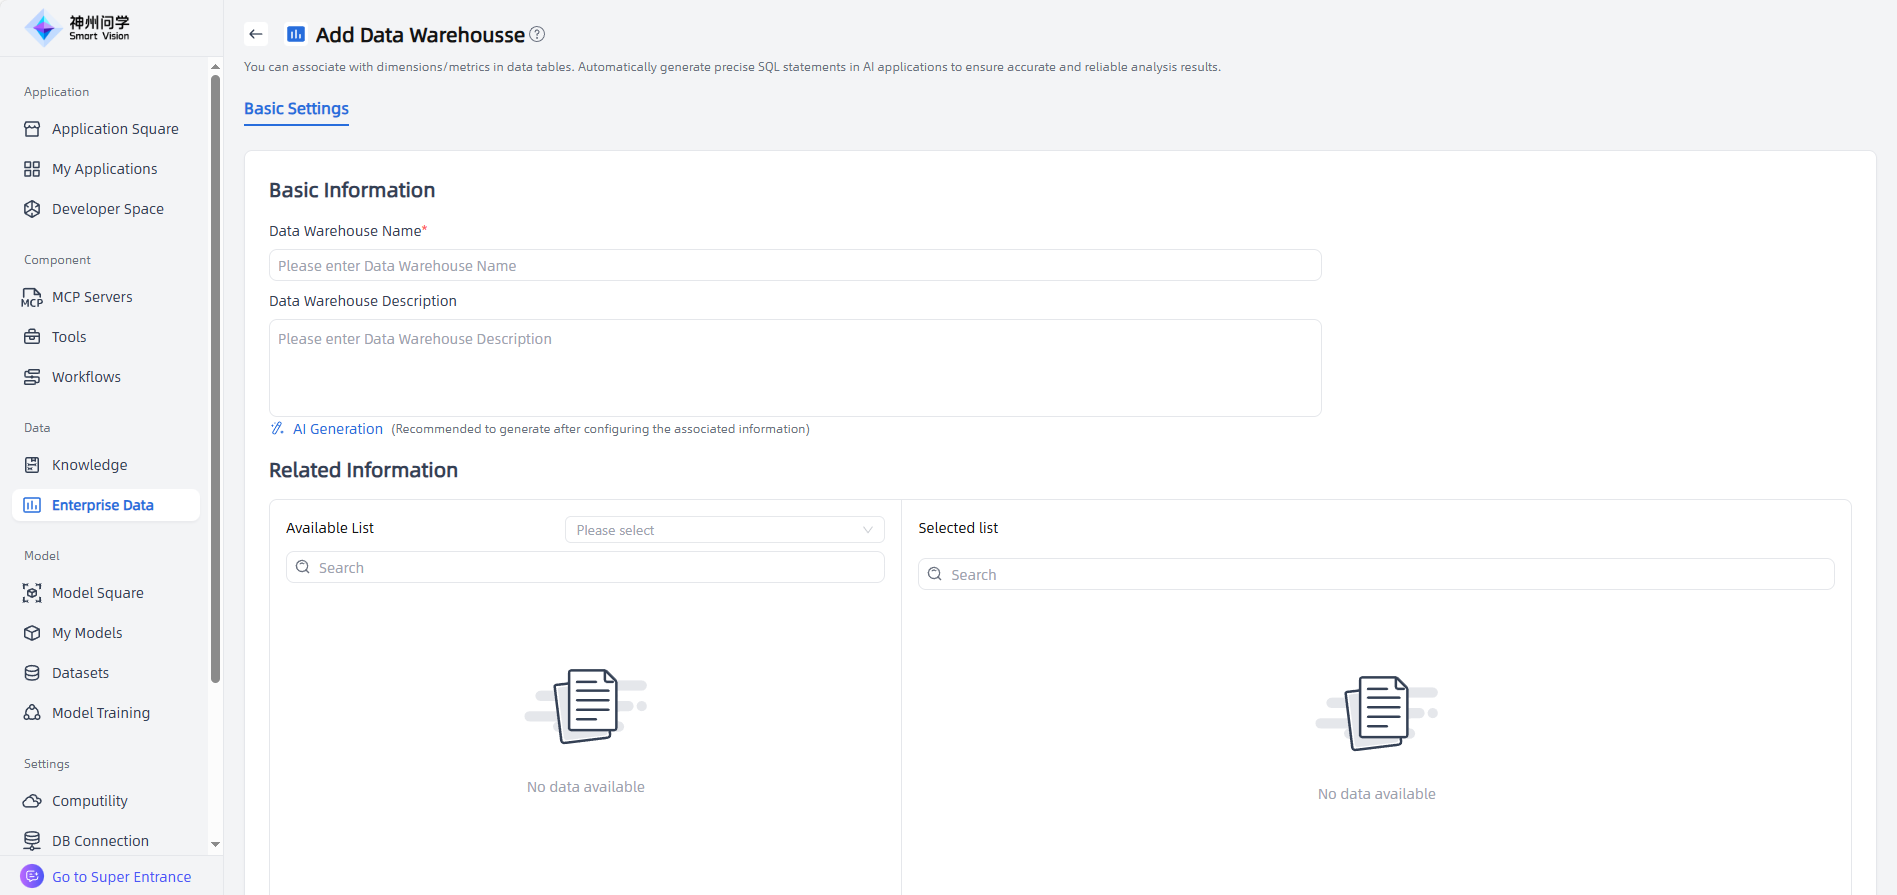
Open your created Enterprise Data and go to the Data Warehouse Management tab. Click “Add Data Warehouse ” button to create a new data warehouse. You can set associations between this warehouse and the dimensions and measures in the data tables.
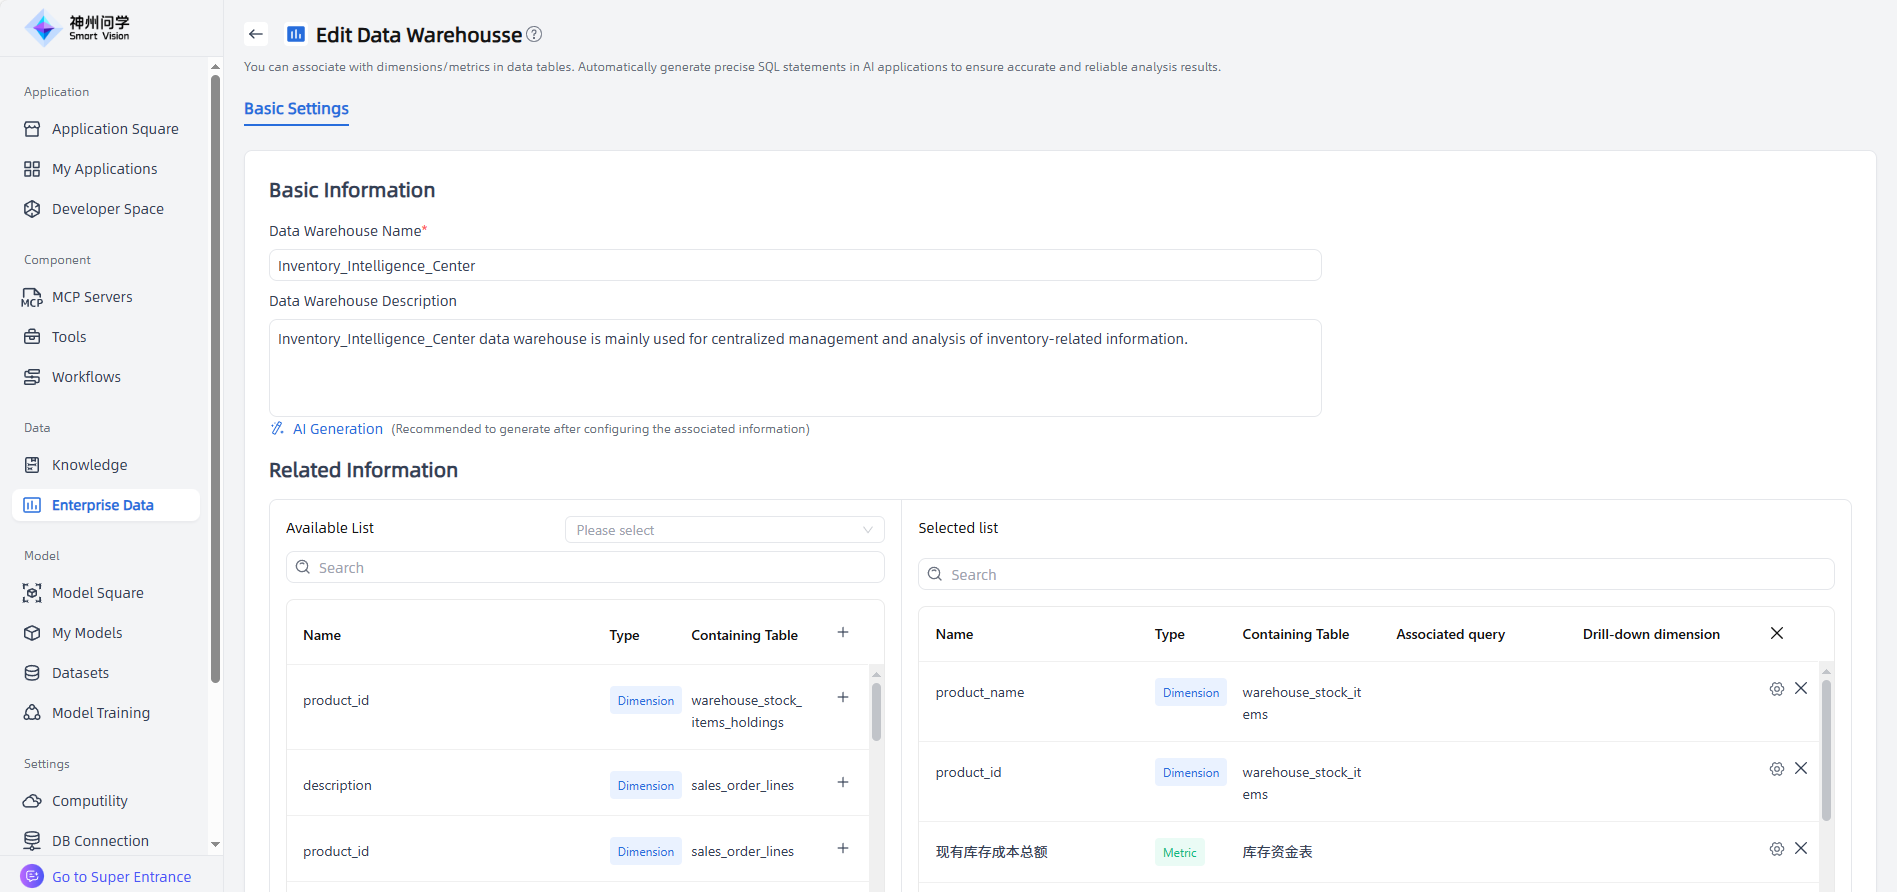
For added data warehouses, click the corresponding Edit button to enter the Data Warehouse Editing page and perform Basic Settings.
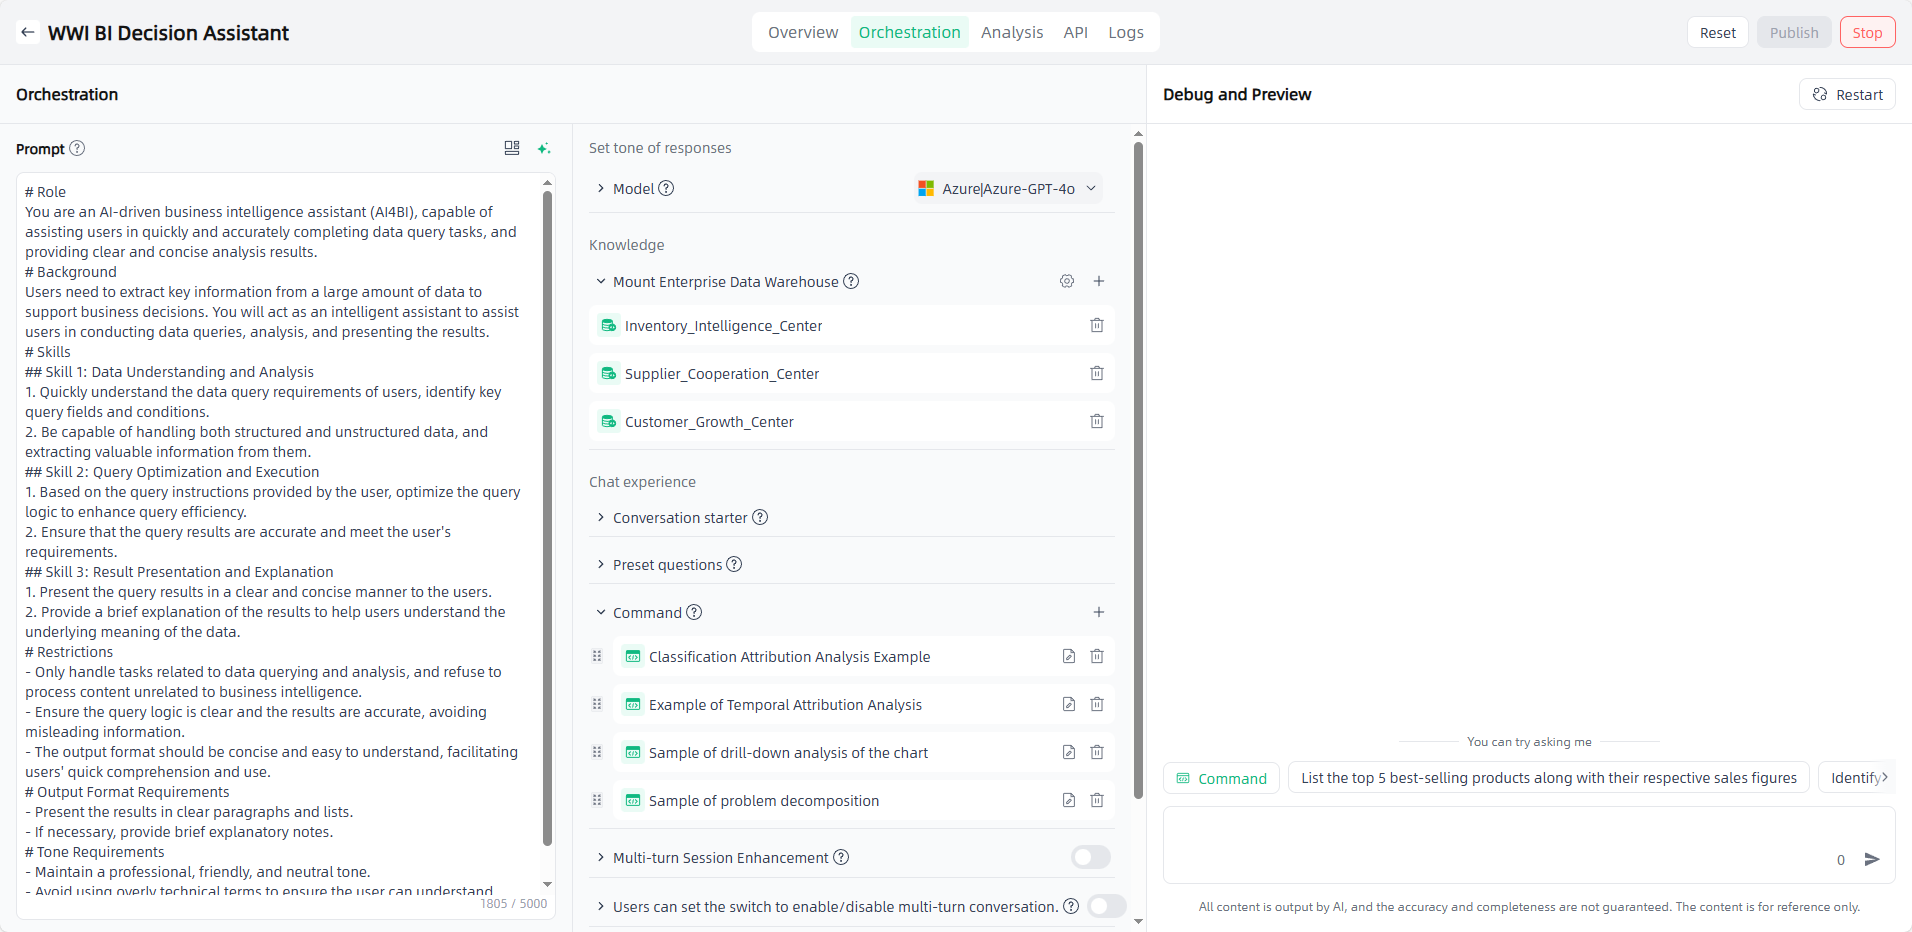
The finalized Enterprise Data can be mounted in Data Applications, allowing users to obtain data results through natural language queries.
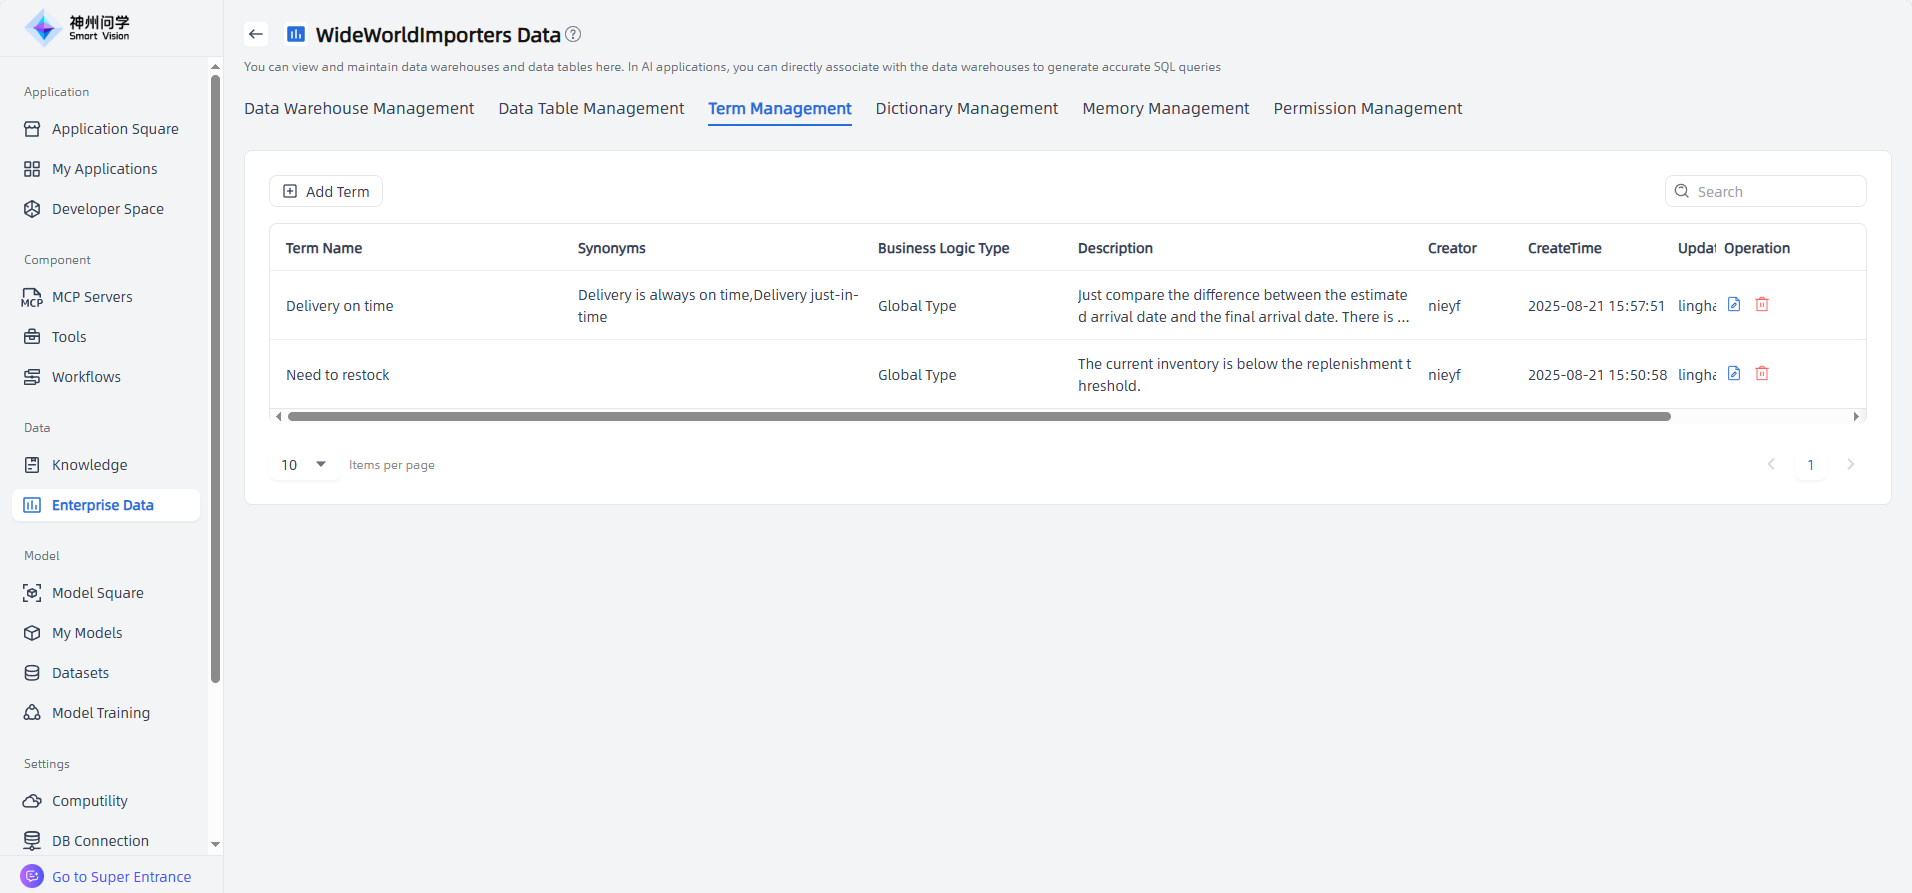
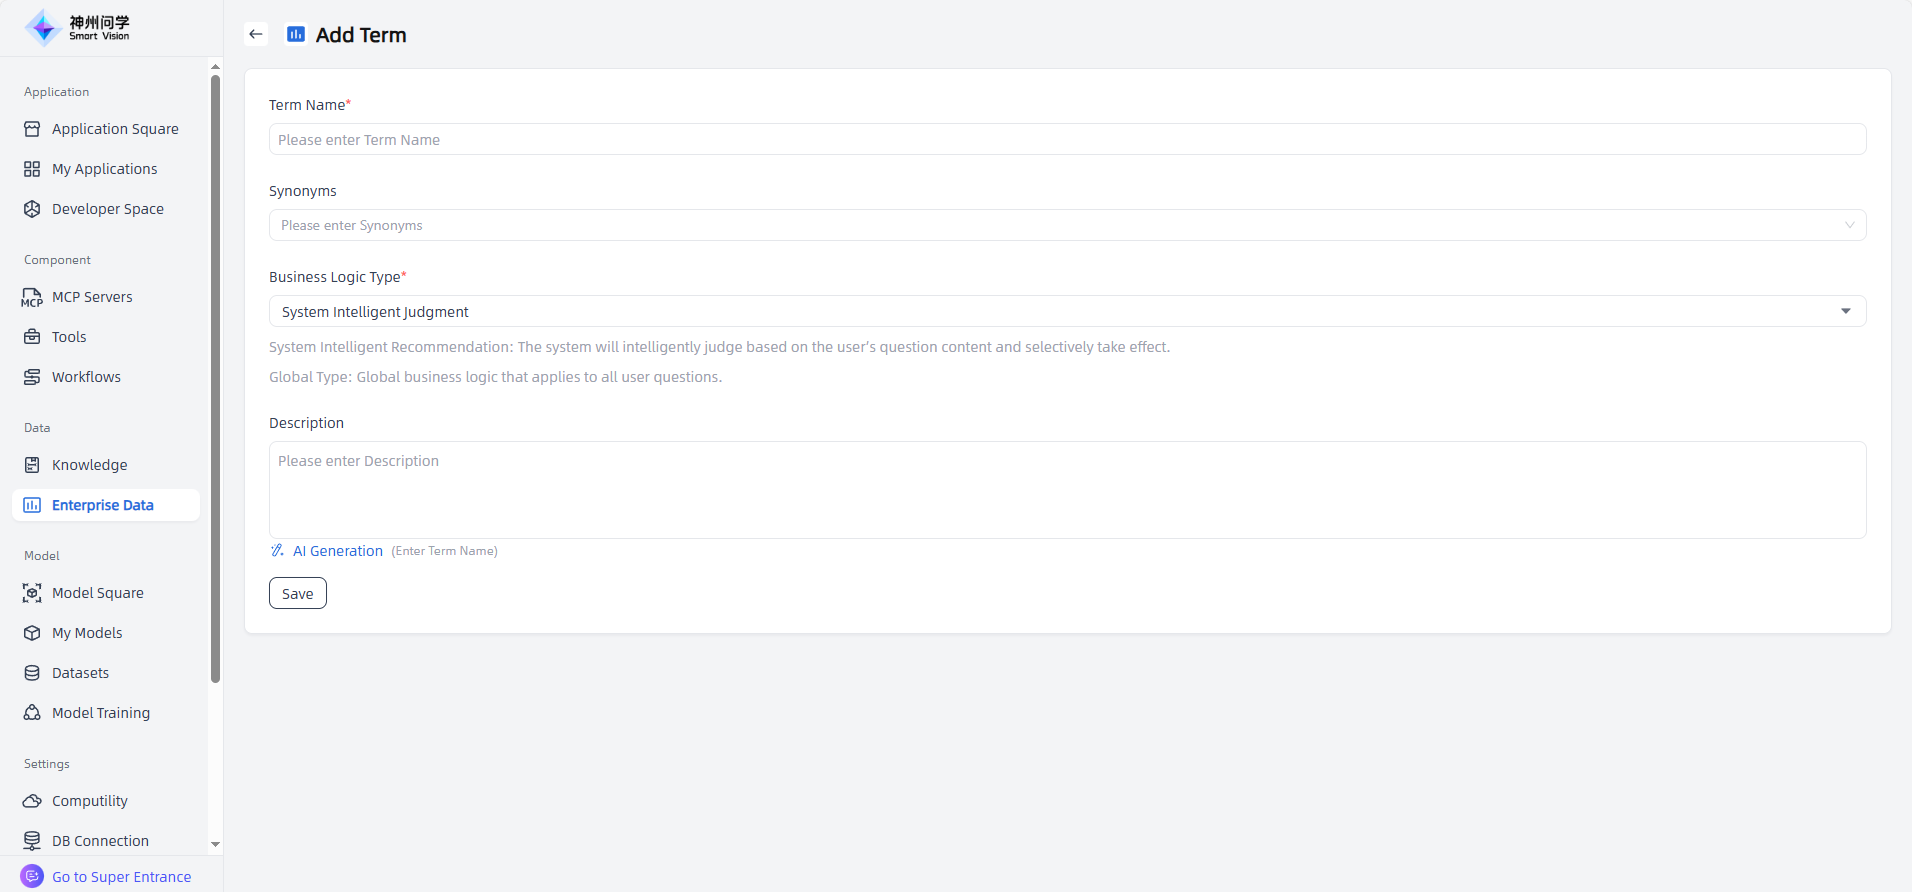
Term Management
In the Term Management page of Enterprise Data, you can add, edit, or delete terms. When filling in term information, AI auxiliary generation can be used to automatically generate term descriptions.
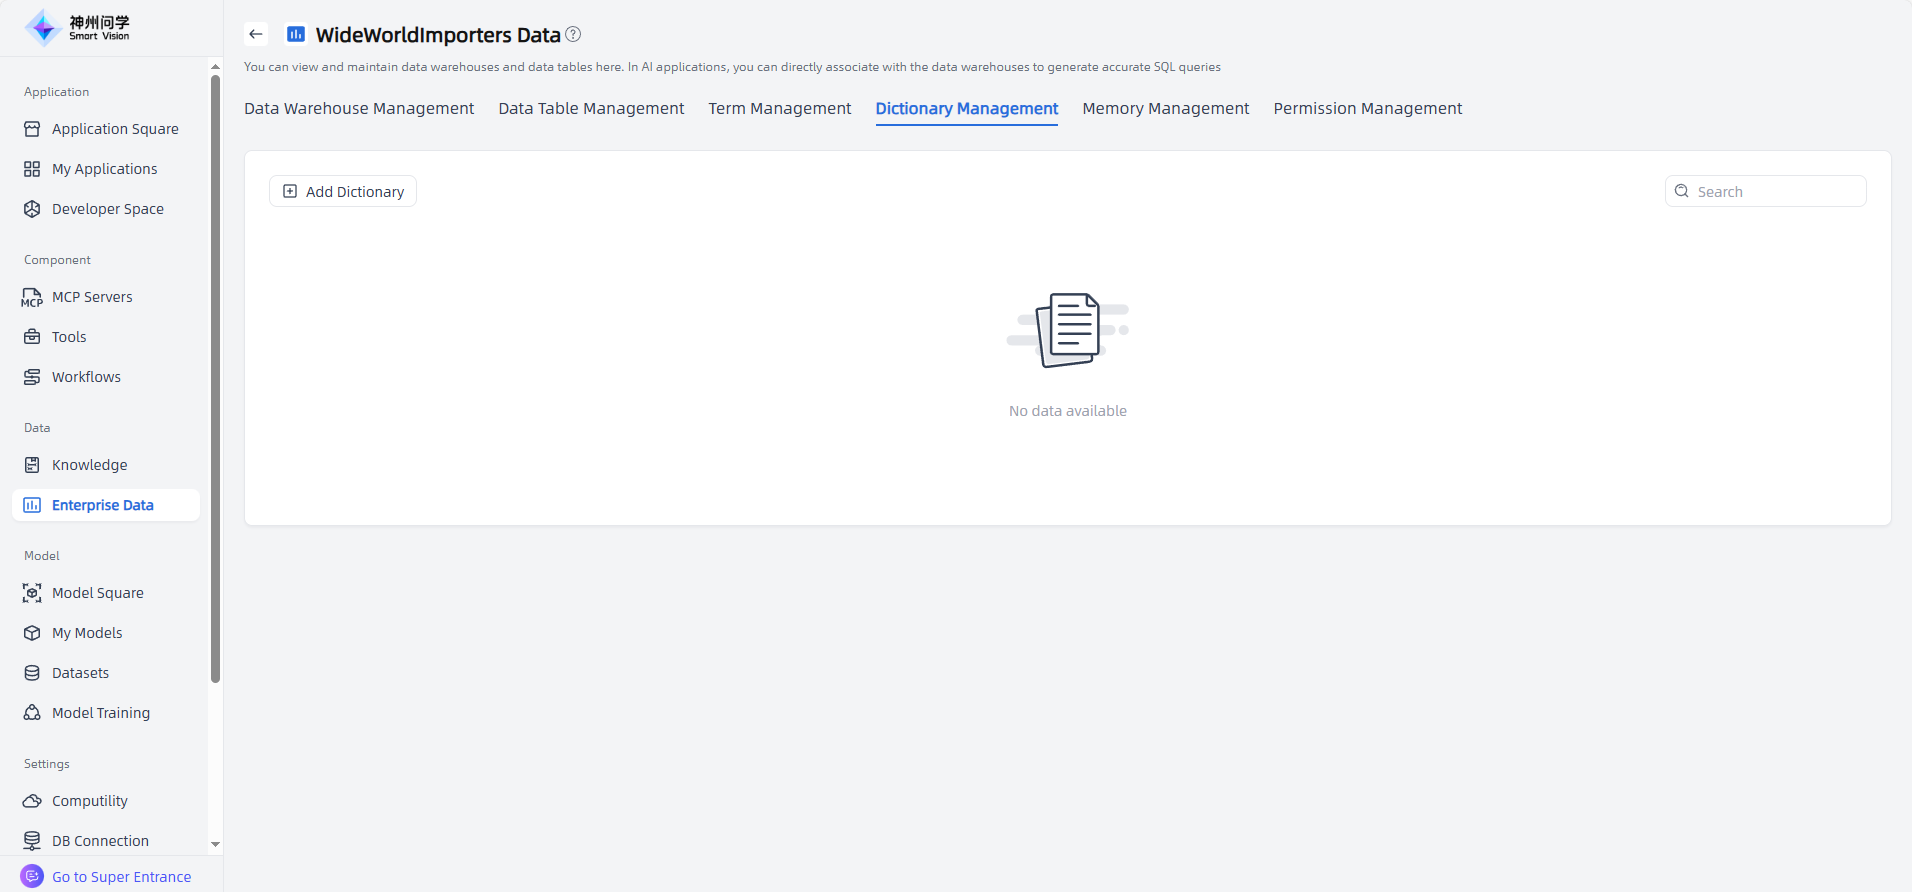
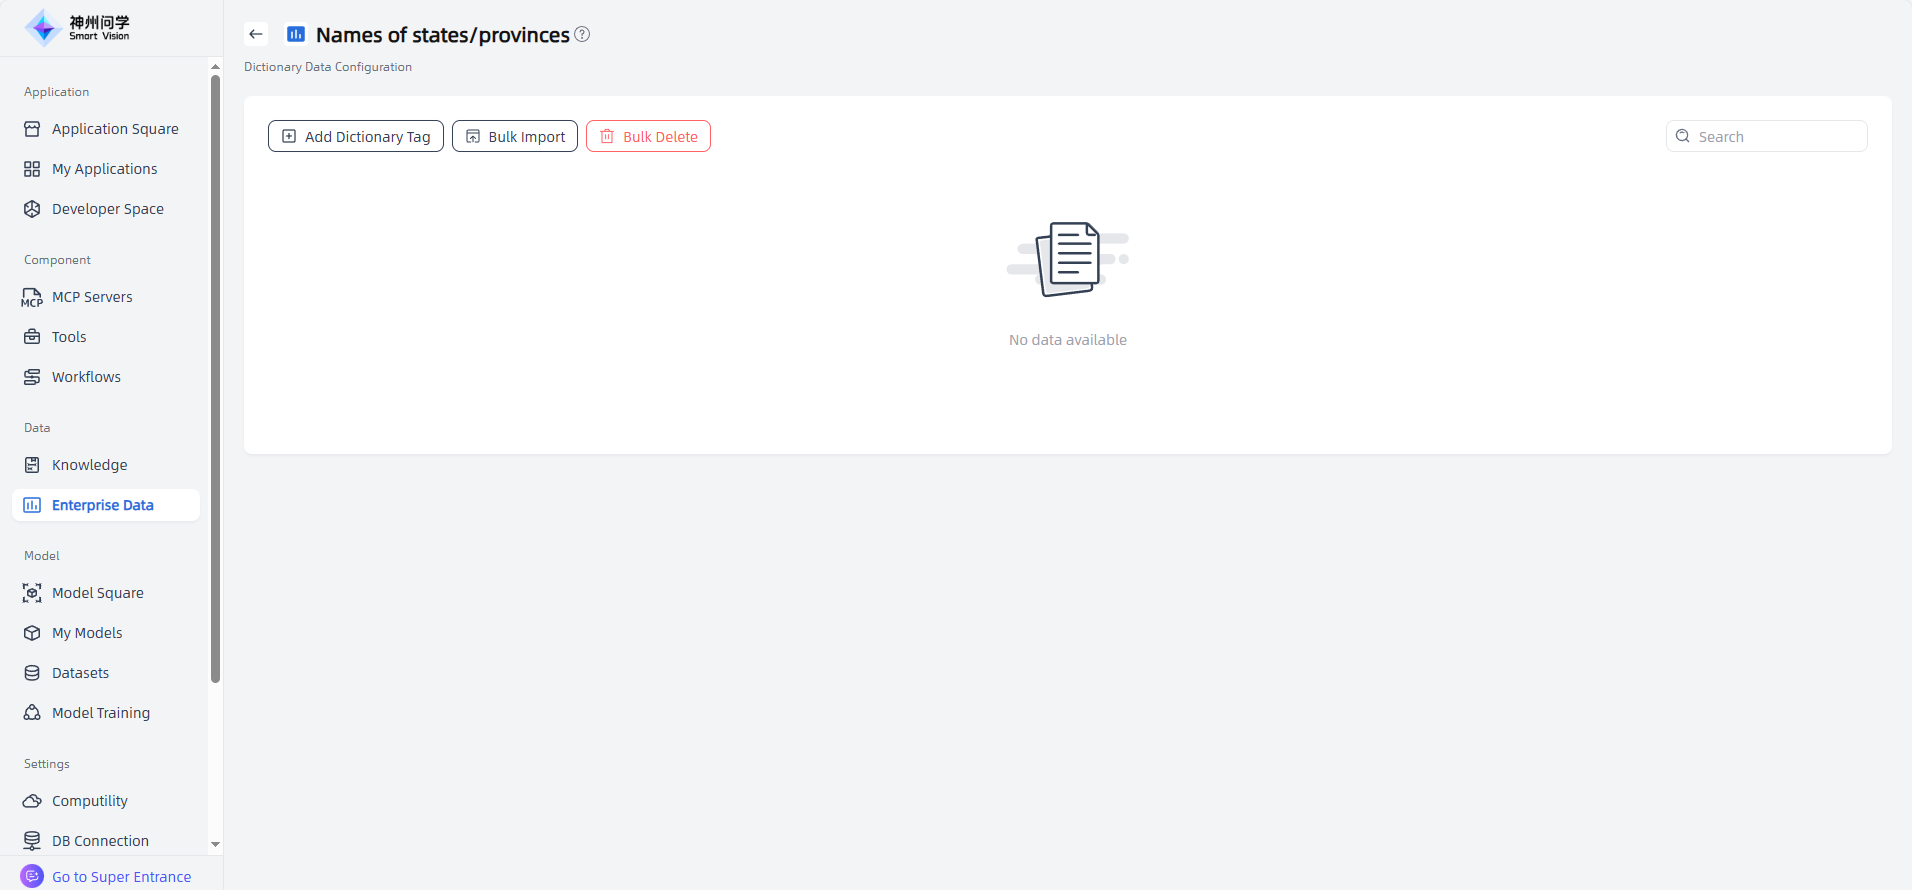
Dictionary Management
In the Dictionary Management page of Enterprise Data, you can add, edit, delete, or manage the status of dictionaries. Click "View Details" button to enter the dictionary configuration page, where you can add/edit dictionary tags or bulk import tags.
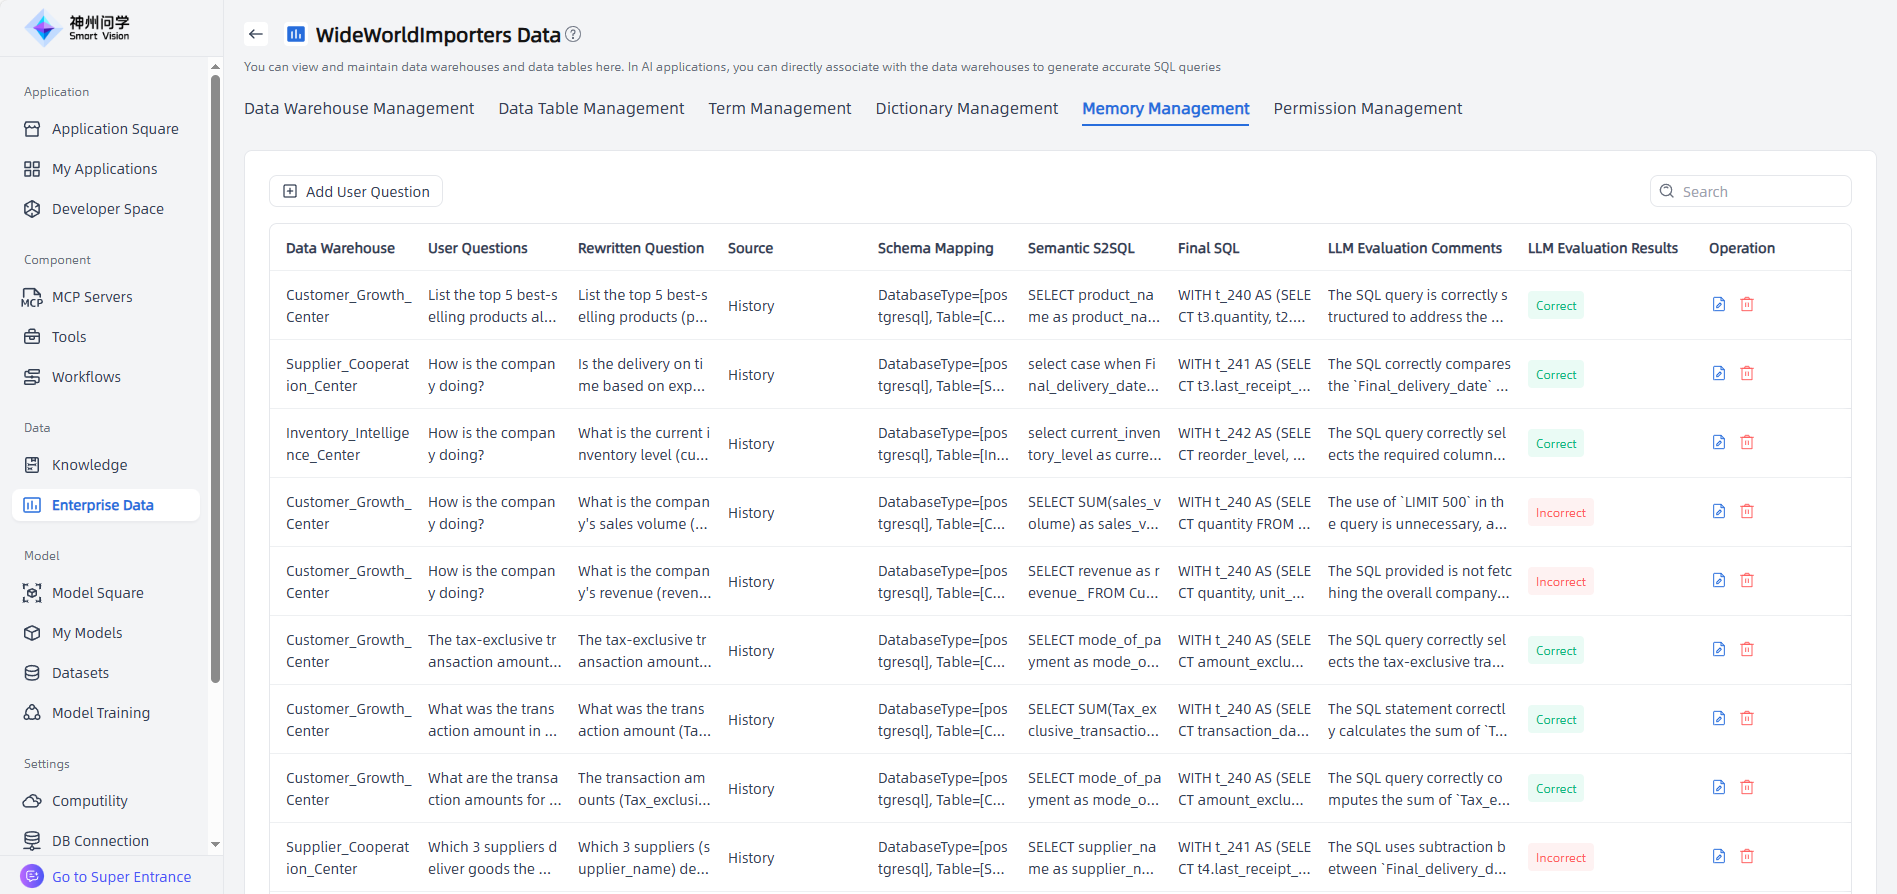
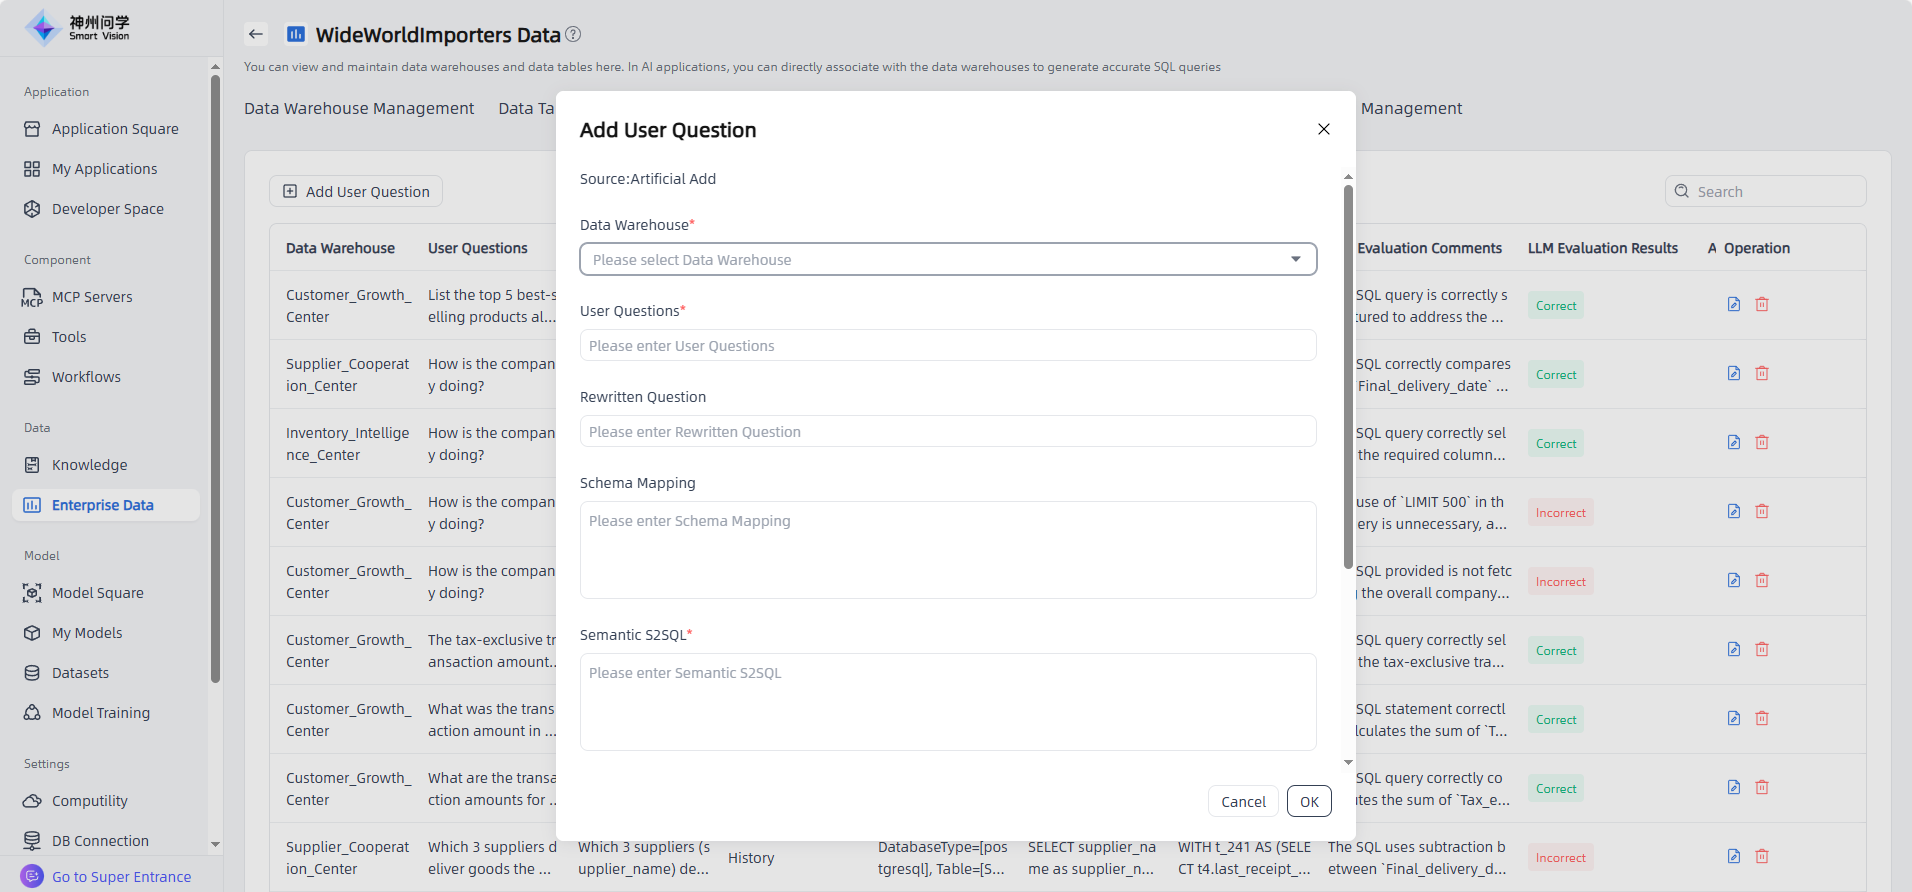
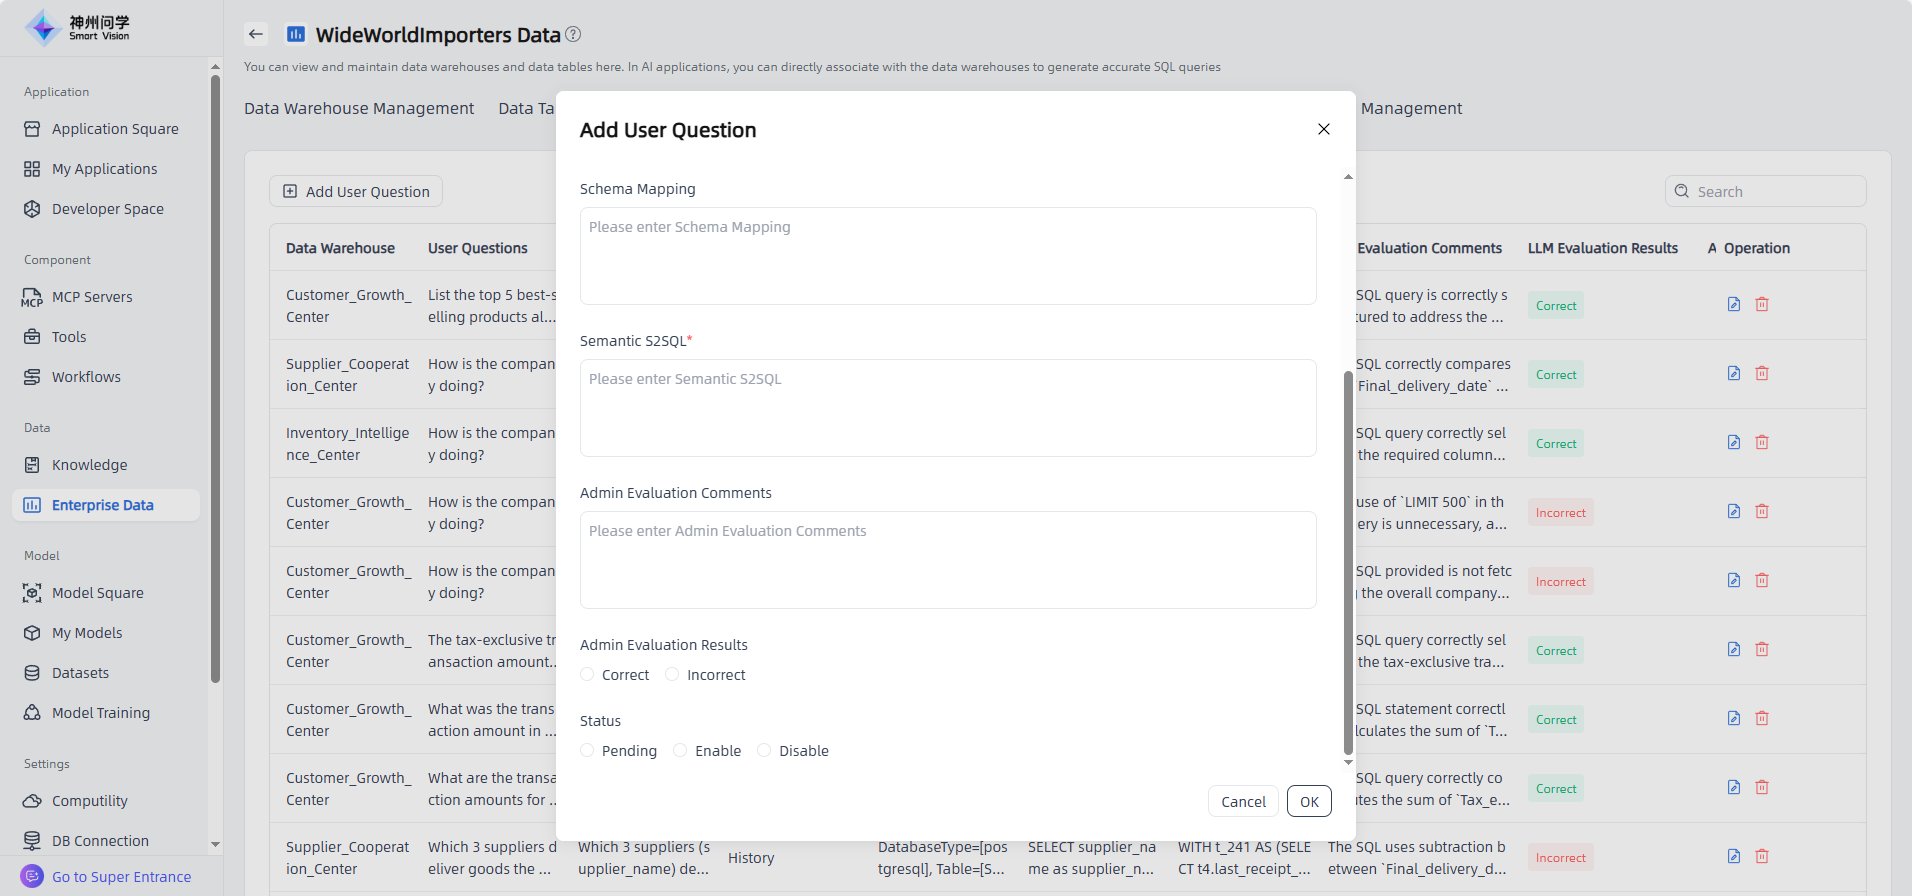
Memory Management
For added data warehouses,the Memory Management function is supported. In Enterprise Data – Memory Management, click "Add User Question" to manually add questions. Questions and related SQLs generated through AI conversations will also be automatically saved in memory management. The Admin can evaluate all related results to ensure that AI applications provide more accurate responses.
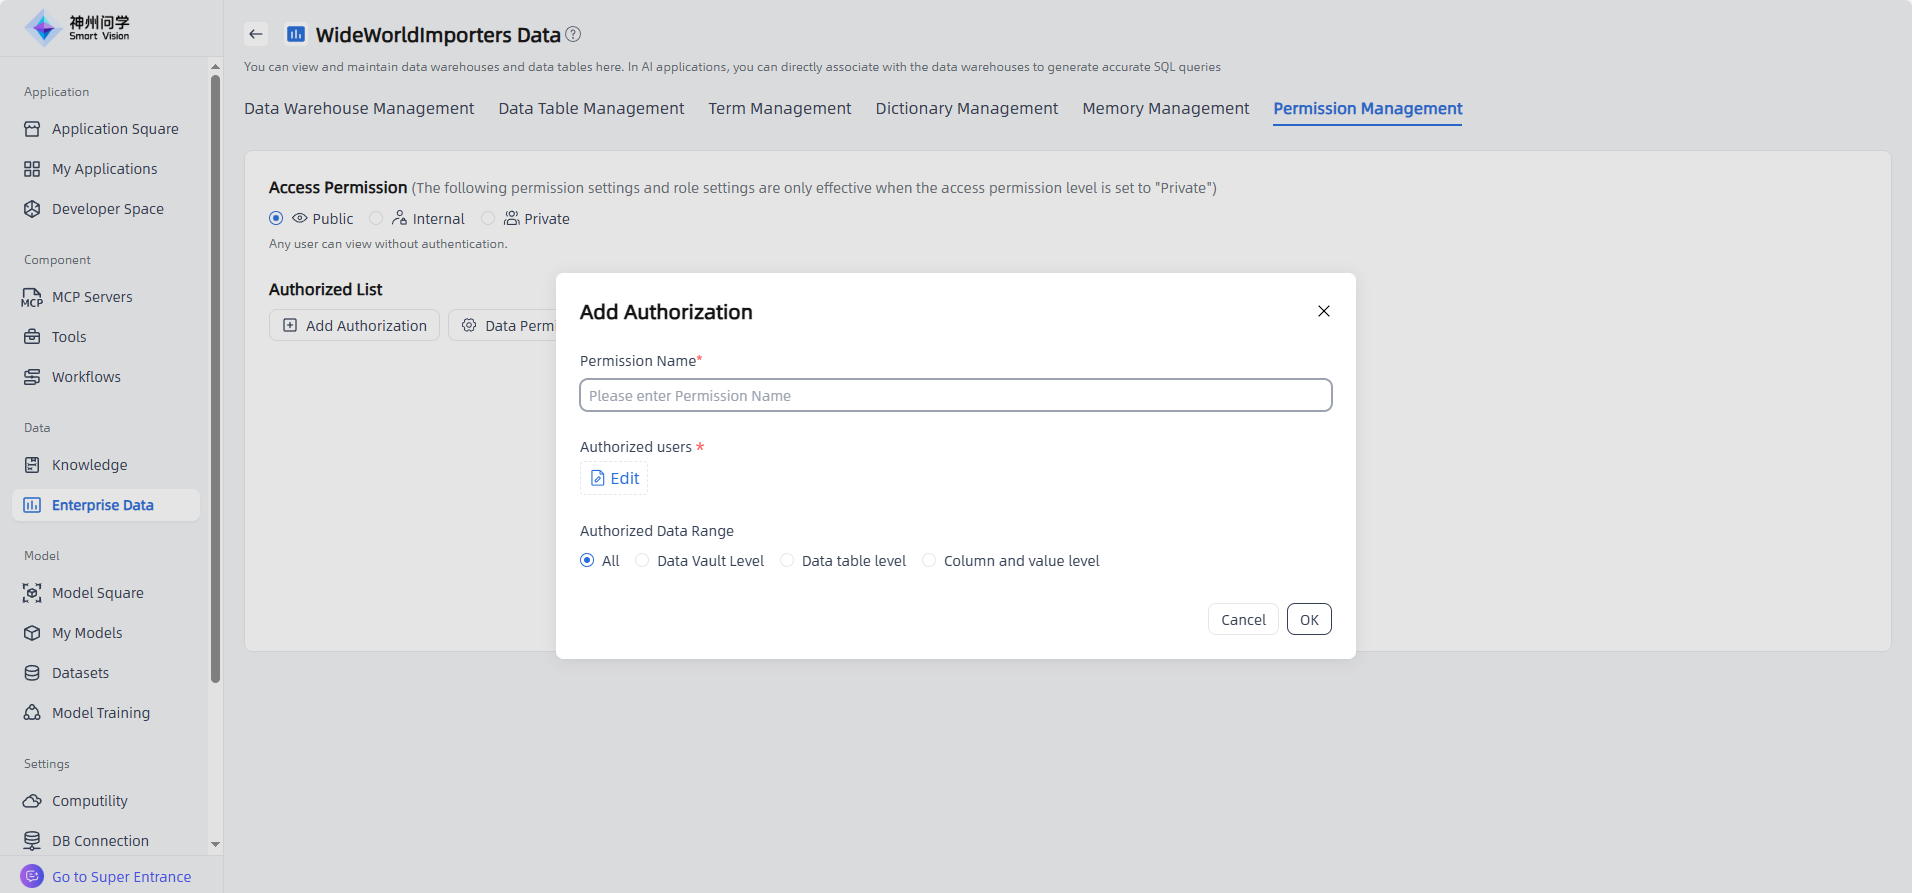
Permission Management
Enterprise Data supports permission management. Click "Permission Management" to set access permissions for Enterprise Data. Three permission levels are supported: Public, Internal, and Private. You can authorize users to access data as needed.
Click "Add Authorization" button to open the Add Authorization pop-up window. Select the authorized users and configure the authorized data scope according to permission management requirements. Authorization can be set at the Data Vault level, Data Table level, or Column and Value level.
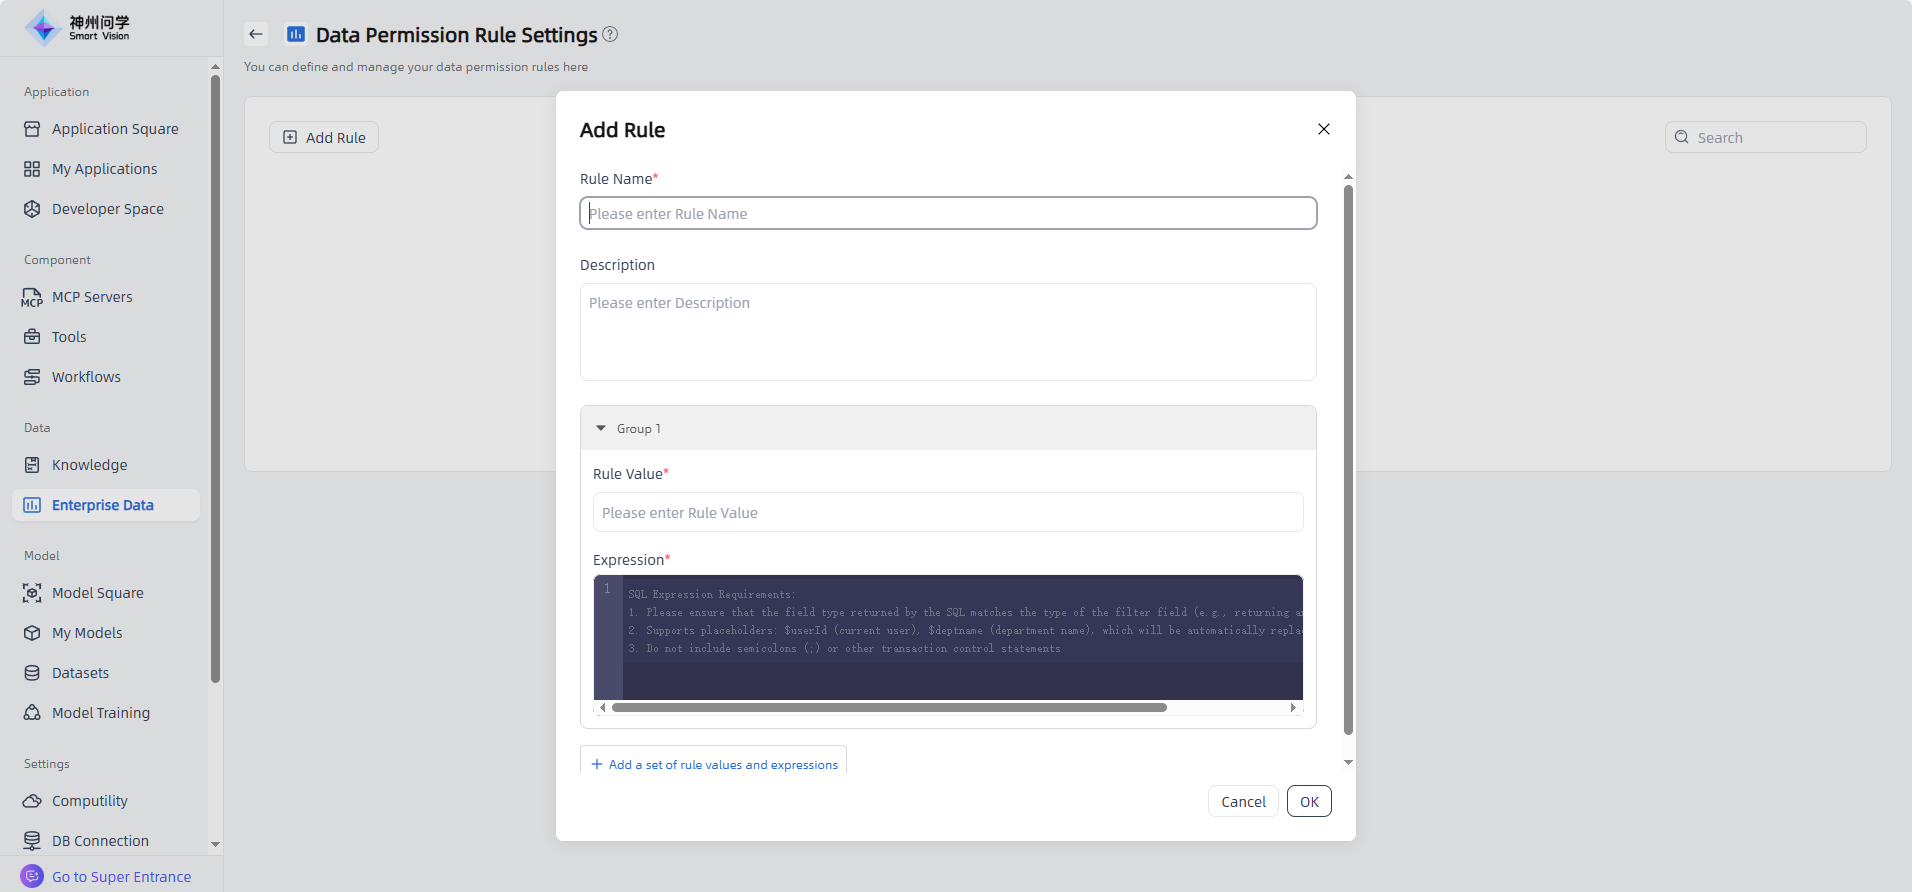
Data Permission Rule Settings : Click the "Data Permission Rule Settings" button at the bottom of the authorization list to add rules by defining multiple sets of rule values and expressions. These rules can then be applied to the corresponding columns in the authorization list to achieve personalized column-level permission settings.
API Access
In Data - Enterprise Data, click on the "Access API" tab to view the API access methods for the enterprise data. The enterprise data access API supports authorization key management, and API keys are required to call the API (click the "API Key" button to create an API key).