Logs
Application log monitoring
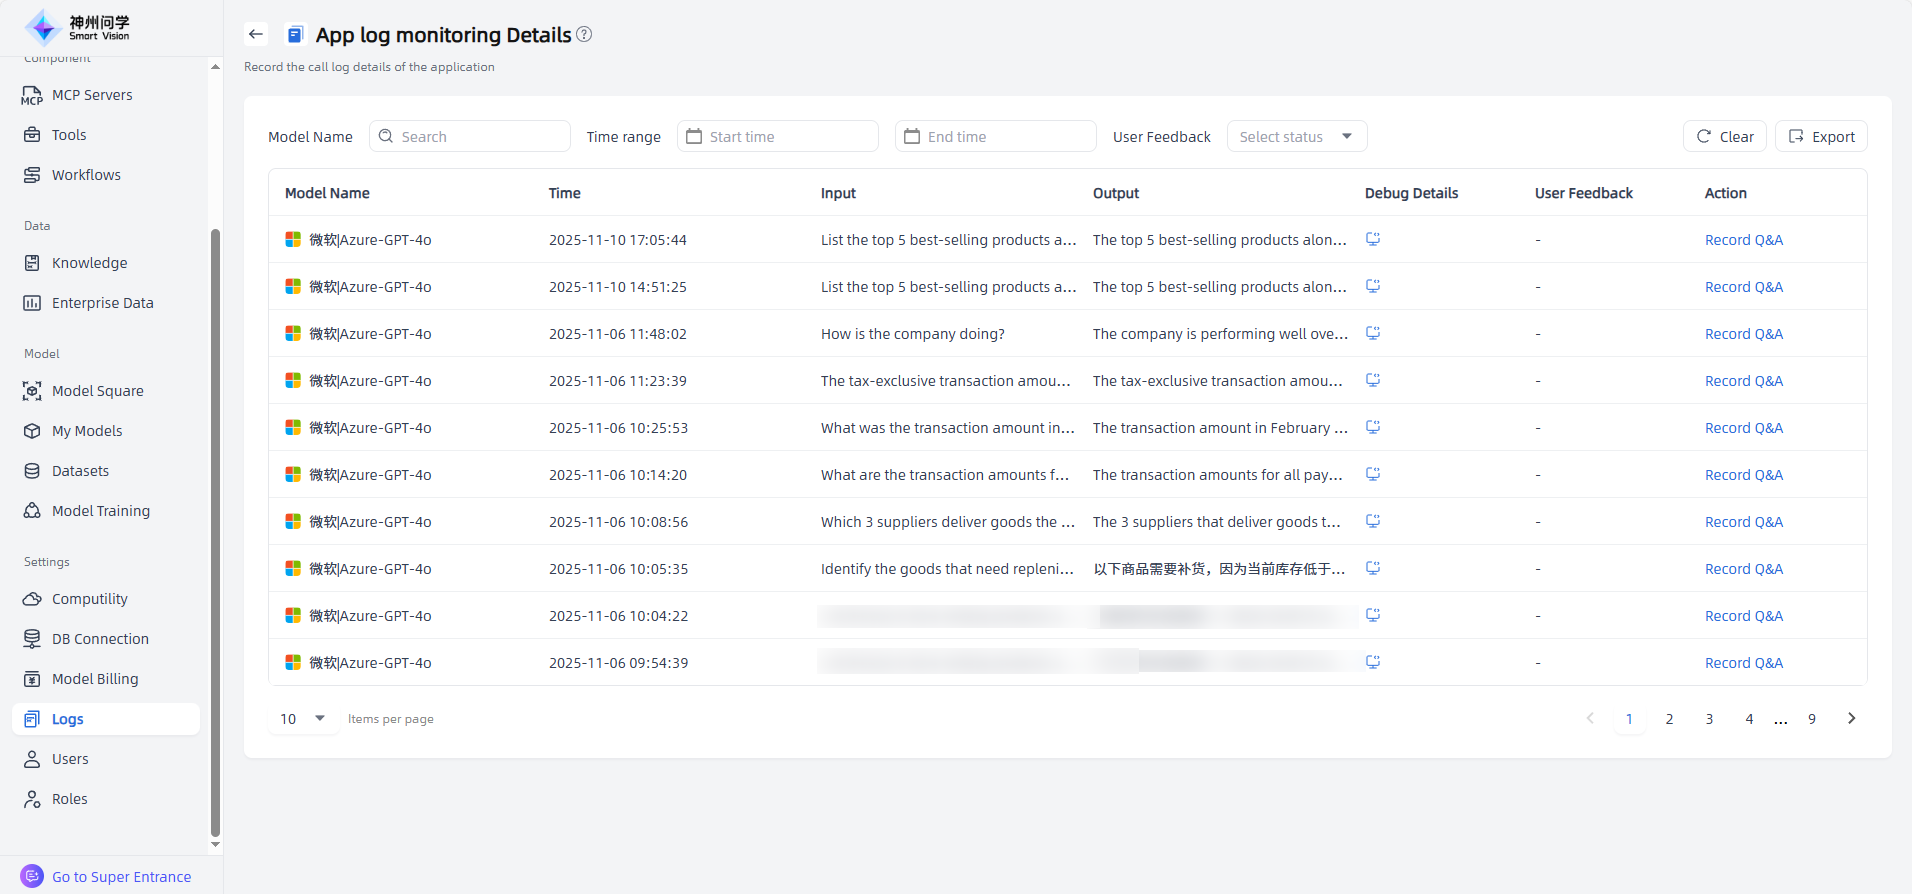
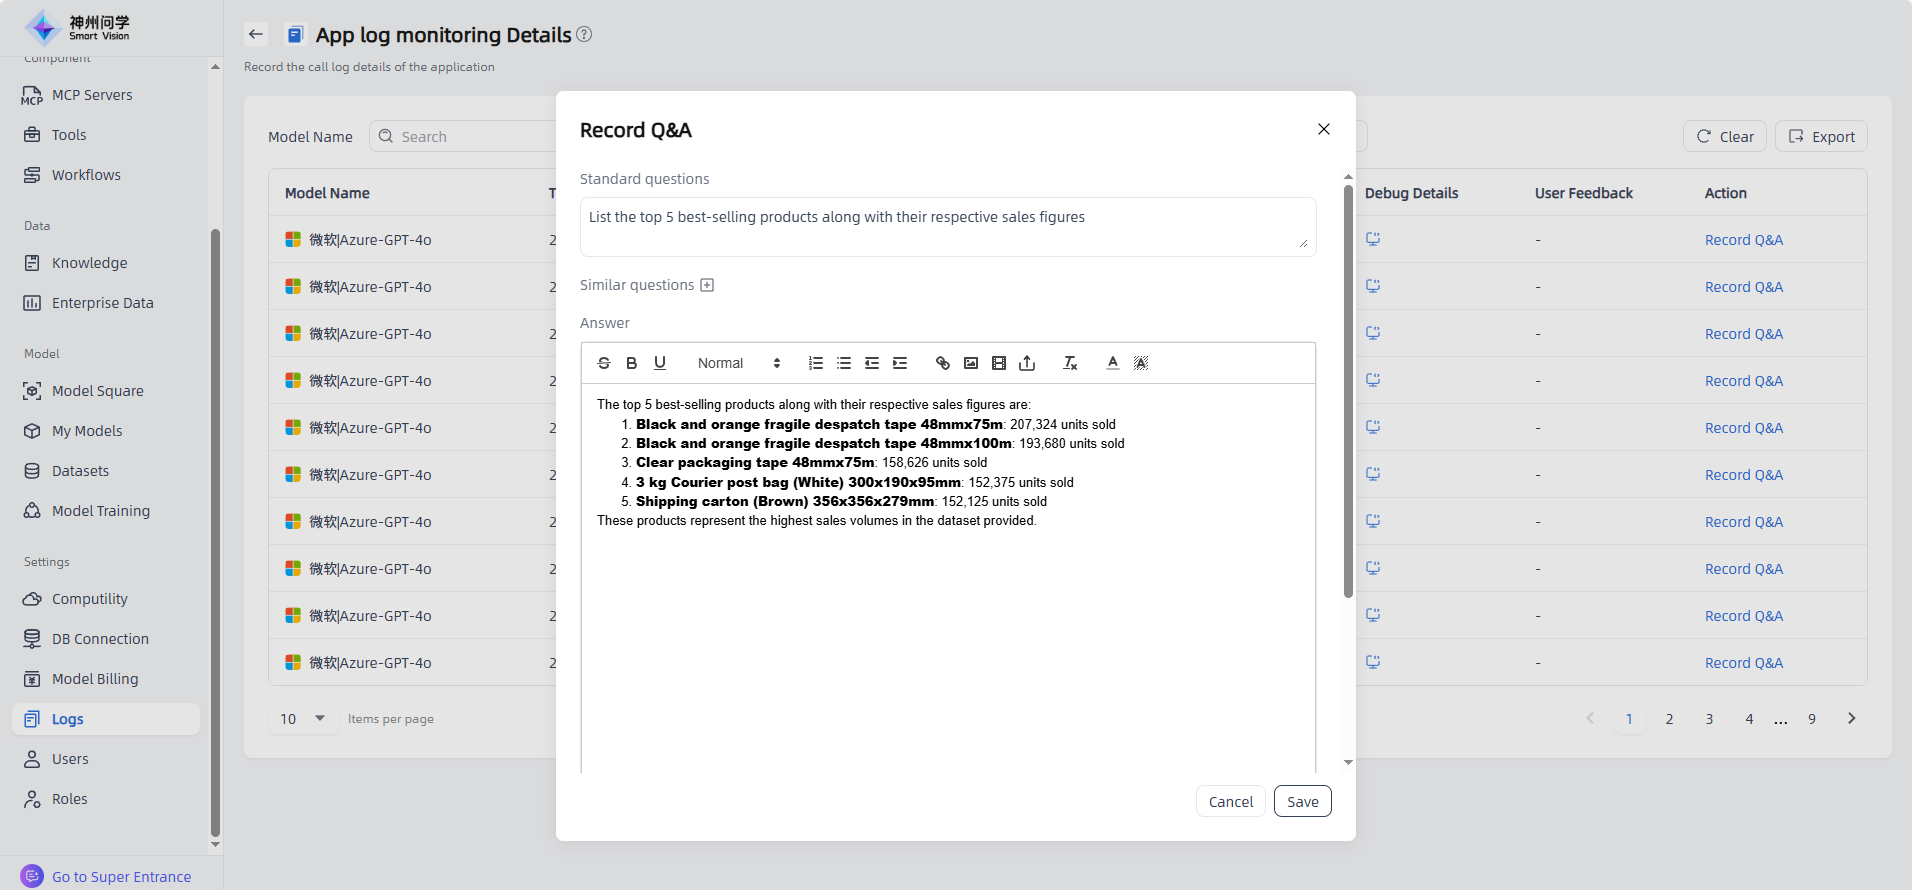
By monitoring the large model calls of each application through log records, you can understand the input and output of the large model in the application, so as to find and deal with problems in time. Click the "Operation" icon to enter the "Log Monitoring Details" page to view the detailed call log of the application.

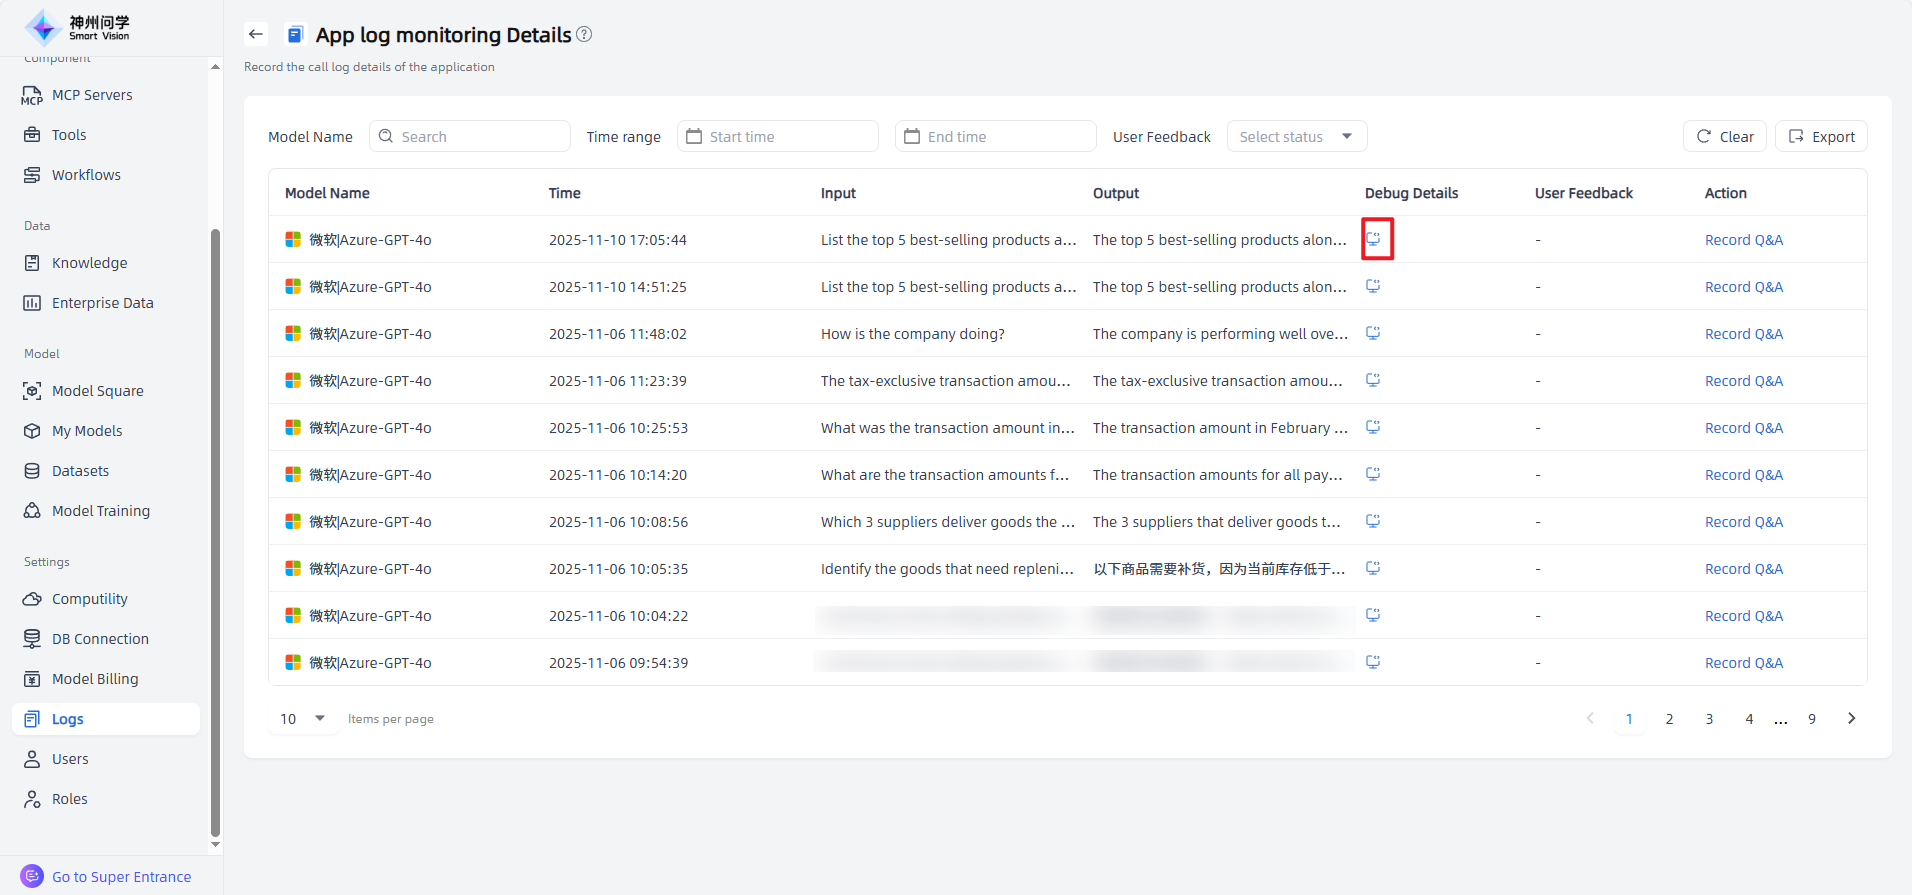
If the monitored application is an Agent Application or Enhanced Application, you can also click the “Debug” button for each Q&A to view detailed call information (supported in both Call Tree and Flame Diagram formats). This helps users understand the source and basis of the answers, accurately locate issues, and ensure the application’s performance.
Additionally, the Application Log Monitoring Details page not only supports viewing user feedback but also allows you to manually add Q&A entries by clicking “Record Q&A”, supplementing the knowledge base and improving accuracy through knowledge feedback.
Operation Log
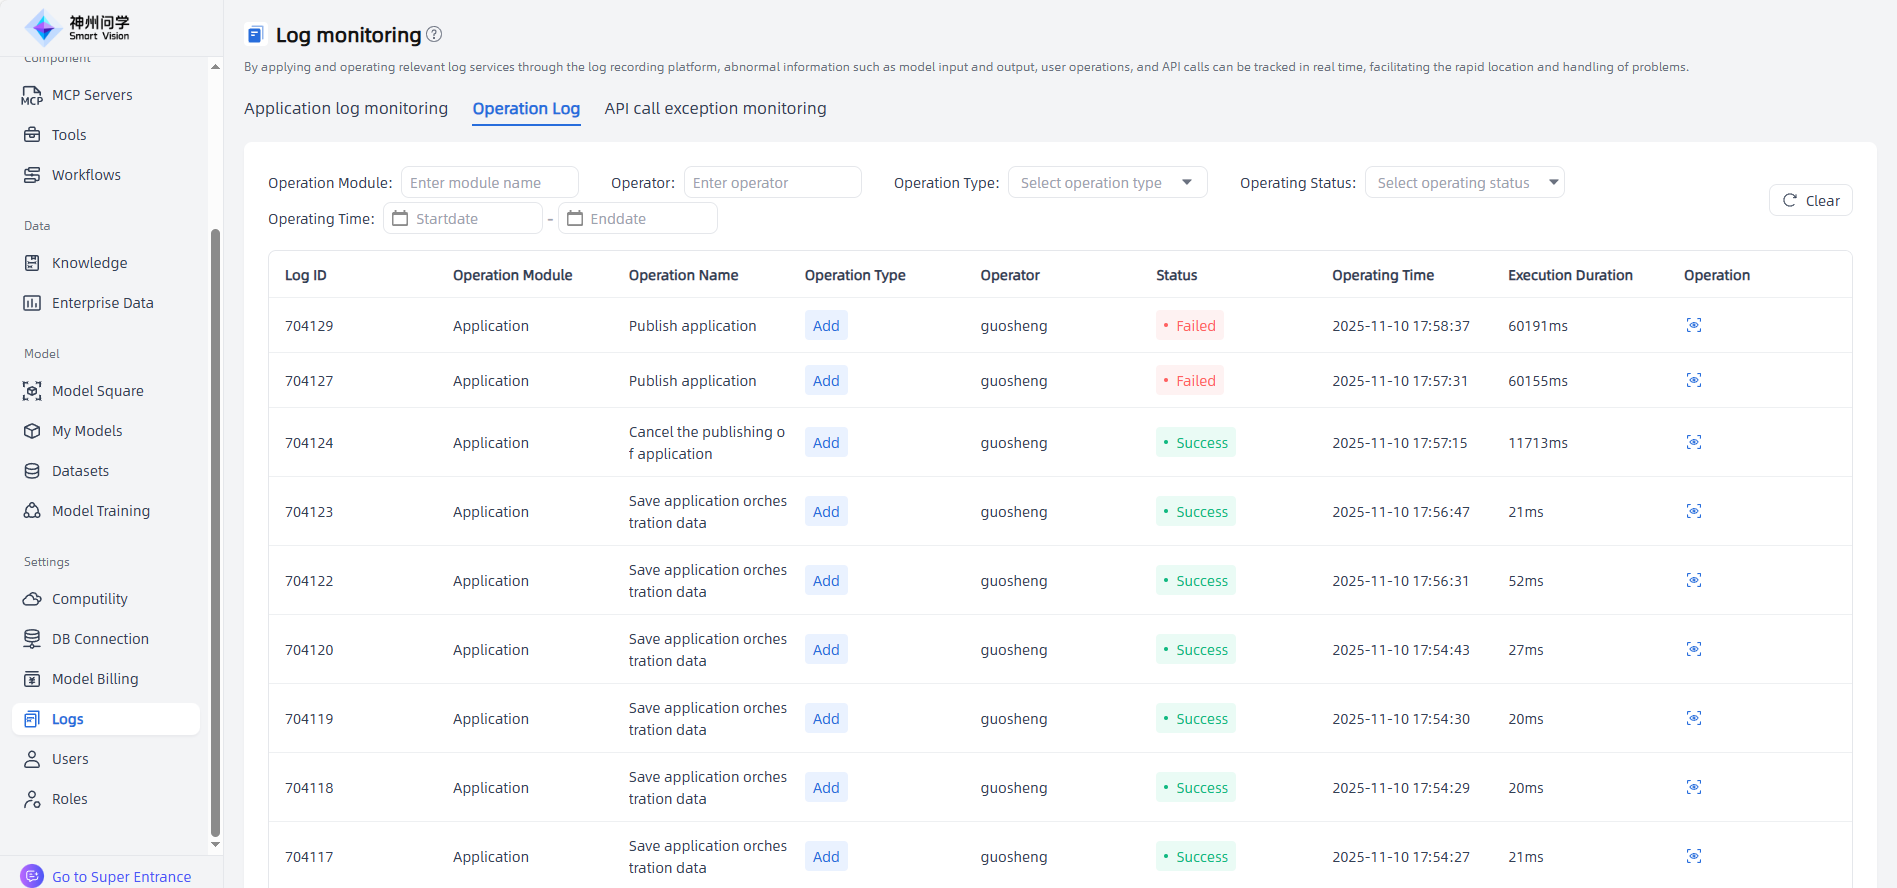
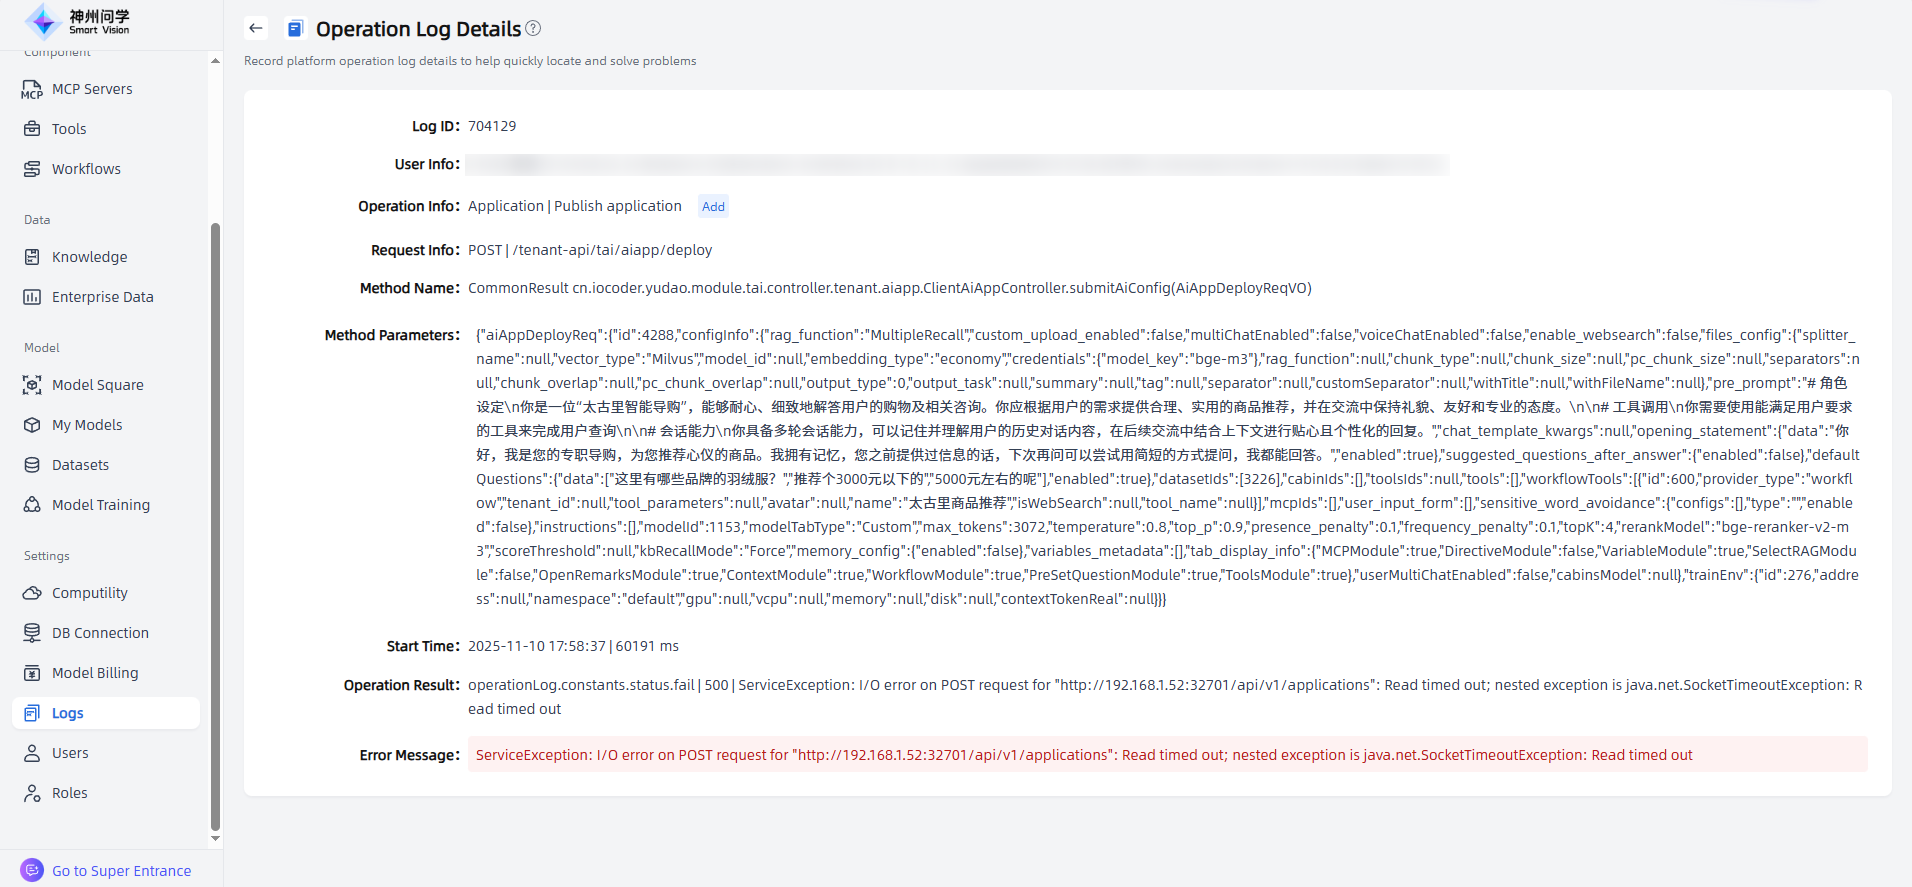
Through the operation log, you can view the operation activities of users under the tenant, monitor operation dynamics in real time, and accurately trace the operator, time, content, and result, forming a complete activity chain. When data anomalies or system failures occur, it helps quickly locate the root cause, shorten troubleshooting time, and reduce potential losses.
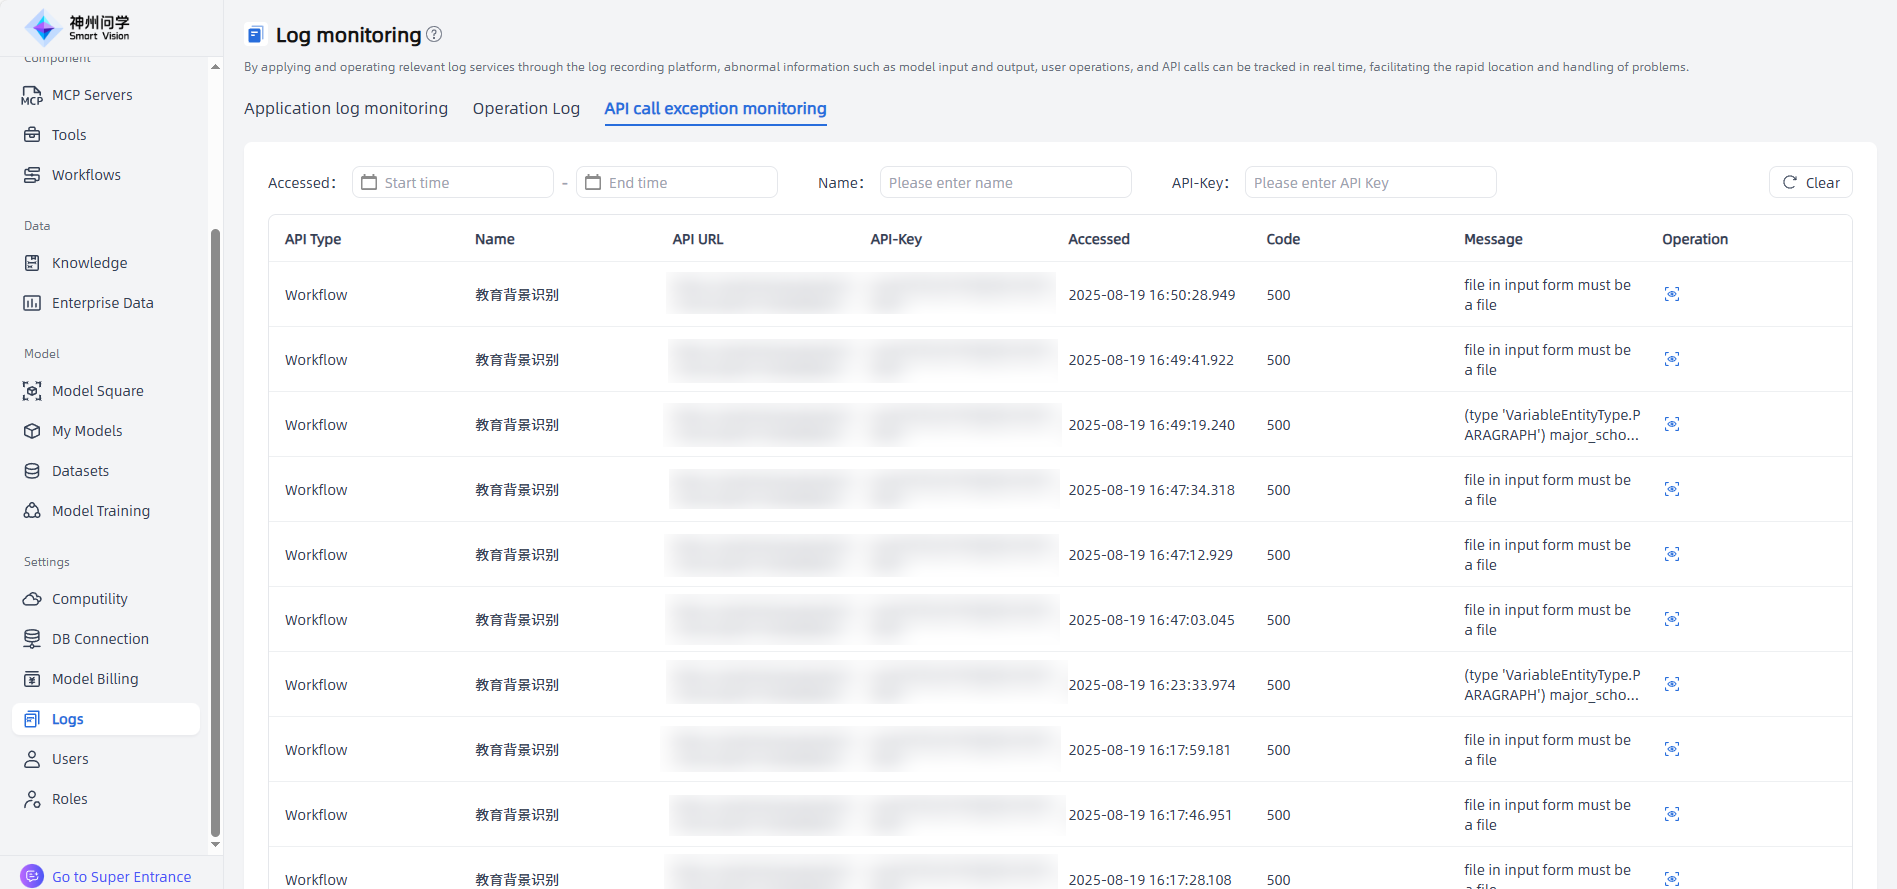
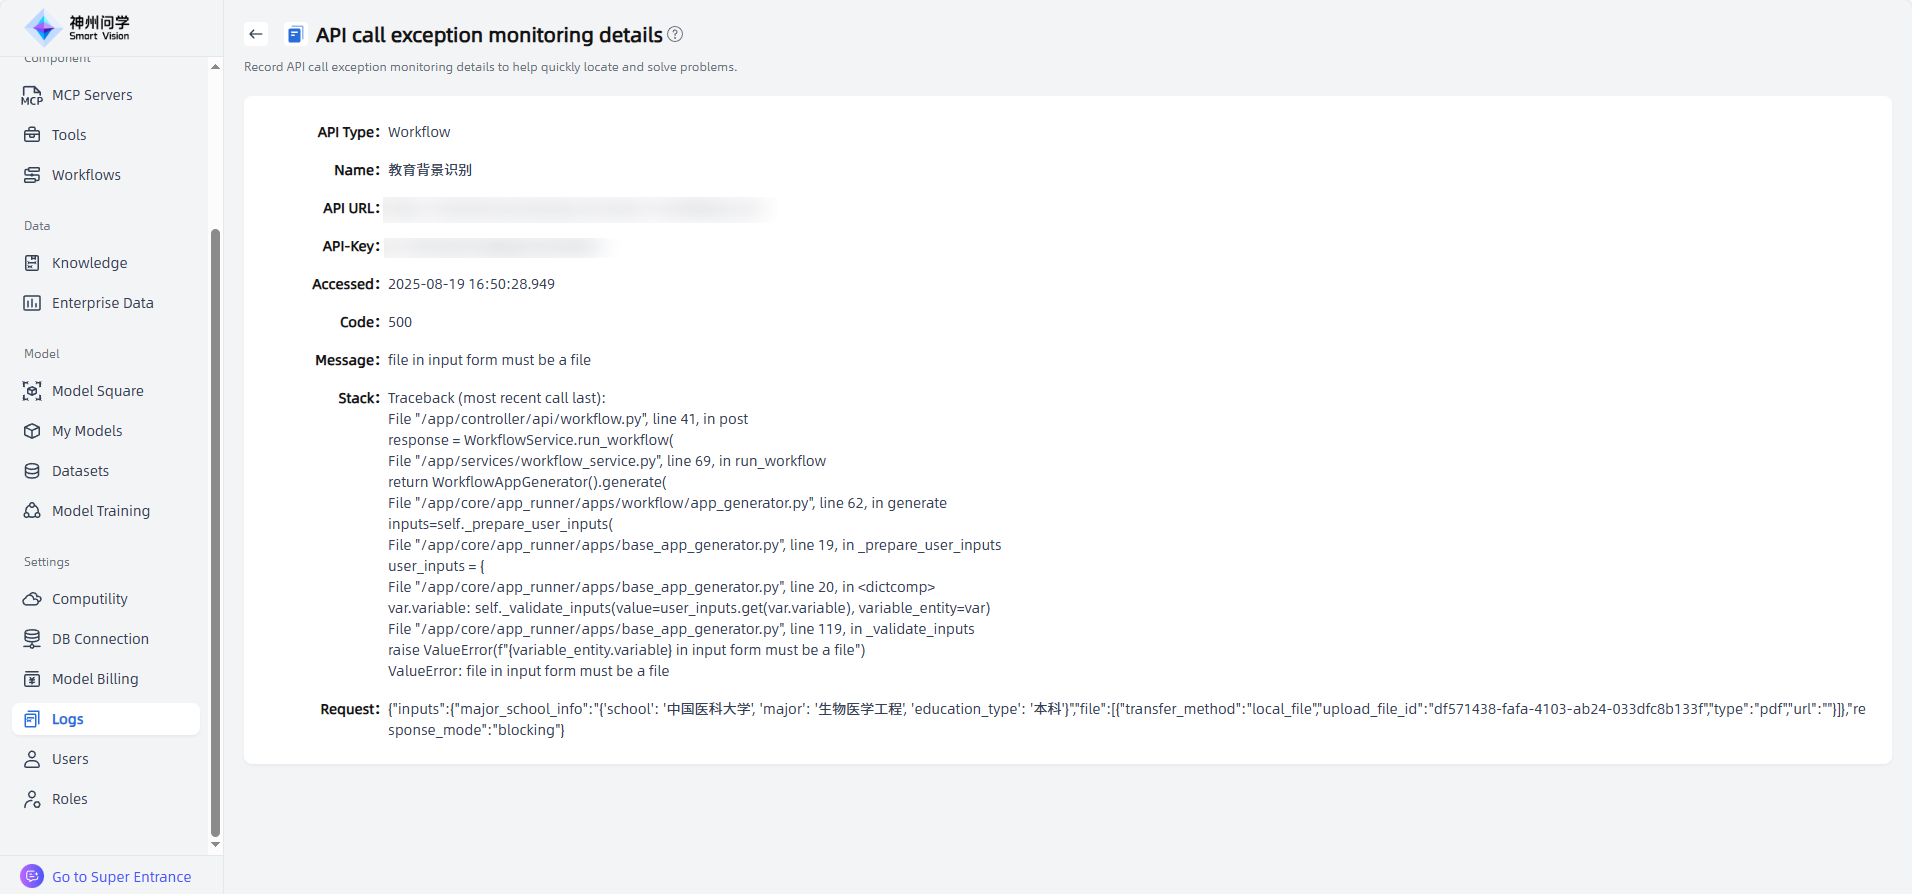
API call exception monitoring
By using API call exception monitoring, users can view the abnormal call status of the API, which facilitates timely detection and handling of problems. Click on the "Operation" icon to enter the "API Call Exception Monitoring Details" page, where you can view the corresponding exception call logs.